Despite decline in some regions, world oil consumption still seen rising
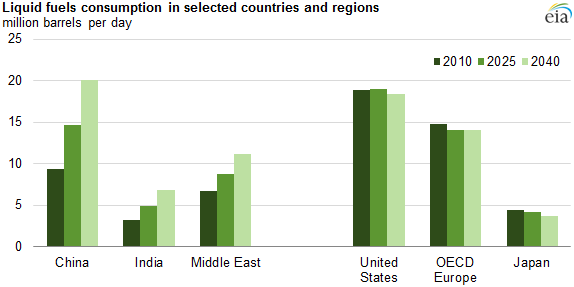
The largest potential for growth in demand for liquid fuels lies in the emerging economies of China, India, and countries in the Middle East, according to EIA's recently released International Energy Outlook 2014 (IEO2014). In the Reference case projection, world liquid fuels consumption increases 38% from 87 million barrels per day (MMbbl/d) in 2010 to 119 MMbbl/d in 2040. China, India, and other developing countries in Asia account for 72% of the net world increase in liquid fuels consumption, with Middle East consumers accounting for another 13%. Most liquid fuel demand is for industrial uses and transportation.
In the United States, Europe, Japan, and other mature industrialized economies, liquid fuel demand has leveled off and is projected to slowly decline. The combined effects of several factors have slowed or even reversed the growth in liquid fuels use. These factors include sustained high oil prices, efficiency standards for vehicles and equipment together with high taxation of motor fuels, price-driven fuel switching towards non-oil fuels outside of transportation, vehicle saturation, as well as structural changes in factors such as demographics and consumer behavior.
IEO2014 projects that 33 MMbbl/d of additional liquid fuel supply will be needed in 2040 compared to 2010 to satisfy growing demand for liquid fuels. The Reference case assumes that Organization of the Petroleum Exporting Countries (OPEC) producers invest in incremental production capacity that enables them to increase crude and lease condensate production by 14 MMbbl/d from 2010 to 2040 and that OPEC crude and lease condensate producers maintain a share of between 40% and 45% of total world liquid fuels production throughout the projection. The Middle East OPEC member countries alone account for 90% of the total growth in projected OPEC crude and lease condensate production.
Non-OPEC crude and lease condensate production is projected to increase by 10 MMbbl/d between 2010 and 2040. Much of this production is projected to come from areas previously considered uneconomical, as a combination of technological improvements and rising world oil prices attract additional investment. In addition, oil from tight and shale resources will help to meet growing demand. Compared to previous reports, IEO2014 incorporates larger new supplies of tight oil from the United States and Canada; but other countries as well, including Mexico, Russia, Argentina, and China, begin producing substantial volumes of tight oil in the IEO2014 Reference case.
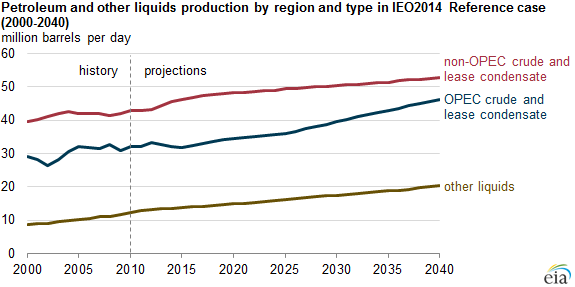
Other liquid resources—including natural gas plant liquids, biofuels, coal-to-liquids, and gas-to-liquids—currently supply a relatively small portion of total world petroleum and other liquid fuels, accounting for about 14% of the total in 2010. However, they are expected to grow in importance, rising to 17% of the world's total liquids supply in 2040.
In addition to the Reference case, the IEO2014 includes scenarios for low and high oil prices. The three price cases examine a range of potential interactions of supply, demand, and prices in world liquids markets. For additional information, see the full report.
Principal contributors: Linda Doman, Laura Singer, Brian Murphy