Electricity transmission investments vary by region
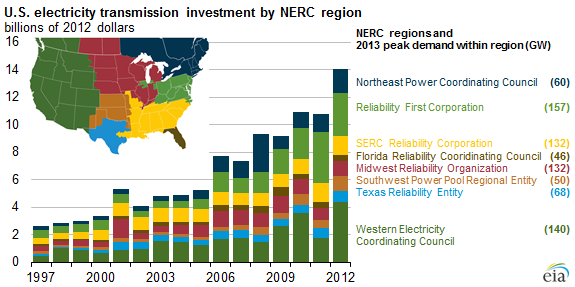
Investment in new transmission infrastructure in the United States by investor-owned utilities has increased substantially over the past 15 years, but varies significantly across regions. Investor-owned utilities have added new transmission for several reasons, including:
- Ensuring grid reliability
- Relieving transmission congestion
- Replacing aging equipment
- Delivering electricity from new renewable generators, often located far from population centers
The Edison Electric Institute expects that annual increases in transmission investment by its members peaked in 2013 with estimated investment at approximately $17.5 billion (real $2012). The following information provides details of North American Electric Reliability Council (NERC) regions with the largest increases in transmission spending by investor-owned utilities.
Western Electricity Coordinating Council (WECC). Since 2009, there has been an increase in transmission expansion in WECC, mostly in Southern California. Between 2003 and 2012, investor-owned utilities spent almost $13 billion to expand transfer capability in Southern California, to ease transmission constraints, and to connect to renewable resources that help meet California's renewable portfolio standard (RPS) target of 33% of its electricity provided by renewable sources by 2020.
The largest of these ventures, the Tehachapi Renewable Transmission Project, consists of 250 miles of 500 kilovolt (kV) and 220 kV transmission lines to support interconnection of up to 4,500 megawatts (MW) of mostly renewable generation. It will serve load growth in the Antelope Valley on the western tip of the Mojave Desert and ease transmission constraints in the Los Angeles basin. The $2.9 billion project began construction in 2012 and is expected to be completed by 2016.
Reliability First Corporation (RFC). RFC contains states along the East Coast from New Jersey to Northern Virginia, and it spreads west to parts of Michigan, Wisconsin, and Illinois. This includes PJM and parts of the MISO regional transmission organizations (RTOs). PJM conducts a regional transmission expansion planning process to
- Ensure reliability
- Ensure the successful operation of wholesale markets
- Consider the effect of state and federal public policy goals such as renewable portfolio standards and energy efficiency standards, among others
Since 2006, annual transmission investment by investor-owned utilities in RFC has doubled compared to previous years. The most expensive projects involve building high-voltage circuits, new long-distance lines, and substations. Two 500 kV lines were completed in 2011 and another is being built. About two-thirds of the investment has been on new system additions, while one-third of the investment has been spent on upgrading and replacing old equipment.
Northeast Power Coordinating Council (NPCC). The NPCC contains the Independent System Operators in New England and New York (ISO-NE and NYISO). Between 1997 and 2012, investor-owned utilities invested $9.2 billion ($2012) in transmission in New England and $4.5 billion ($2012) in New York.
From 2002 through June 2013, 475 transmission projects went into service in New England to bolster system reliability, support a competitive wholesale electricity market, reduce congestion, and decrease the added cost of must-run generating units during those times. These projects included nine major 345 kV lines to reinforce the system's critical load pockets that had experienced significant load growth.
Texas Reliability Entity. In response to state legislation, the Texas Public Utility Commission assigned competitive renewable energy zone (CREZ) transmission projects to various utilities across the state. Now nearly complete, the $7 billion project will span 3,588 miles and transmit at least 18,500 MW of wind power from West Texas and the Panhandle to highly populated metropolitan areas of the state. These transmission expansions have decreased the instances of wind curtailments and negative real-time electricity prices in Texas.
Principal contributor: Lori Aniti
Tags: electricity, transmission, utility