
August differentials offer insight into Aramco’s oil pricing
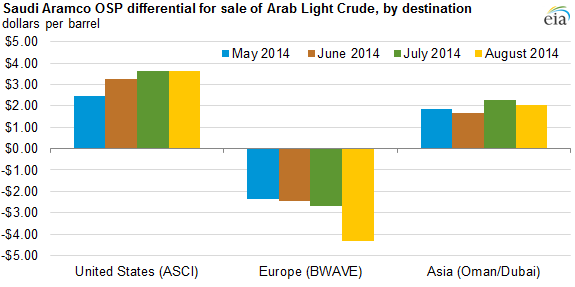
Note: OSP is Official Selling Price; ASCI is Argus Sour Crude Index; and BWAVE is Brent Weighted Average. The differential charged to each region is based on a different crude oil price benchmark: ASCI for the United States, BWAVE for Europe, and Oman/Dubai for Asia.
Saudi Arabia produces and sells its crude oil via Saudi Aramco, its state-owned oil company. Like many such companies, Saudi Aramco sells its oil to long-term customers at an official selling price (OSP). Saudi Aramco adjusts the OSP monthly based on specific conditions in different regions of the world.
For example, refiners in the United States that import Arab Light crude oil this month will expect to pay the Argus Sour Crude Index (ASCI) price plus a differential of +$3.65/barrel. While differentials to the United States have not changed from July to August, Aramco has reduced its differentials for other destinations, especially Europe. According to Arab Oil & Gas, these reductions reflect the anticipated reopening of the Ras Lanuf and Es Sider terminals in Libya, which could increase that country's crude oil exports by 500,000 barrels per day. They also reflect the intention for Saudi oil to remain competitive in southern European markets.
Saudi Aramco's OSP is calculated on a differential to a crude benchmark based on destination and crude quality, taking into account product yields and local market conditions. Each month, Saudi Aramco publishes these differentials, which determine the OSP for the following month.
- Asia. For crude oil exported to Asia, the OSP is a differential to the average of Dubai and Oman crude prices published by the pricing agency Platts.
- Europe. Crude oil exported to Europe and the Mediterranean has an OSP based on the Brent Weighted Average (BWAVE) published by IntercontinentalExchange.
- United States. Crude oil exported to the United States has an OSP based on the Argus Sour Crude Index (ASCI), which is a price index based on crude oil produced from oil fields (Mars, Southern Green Canyon, and Poseidon) in the U.S. Gulf Coast.
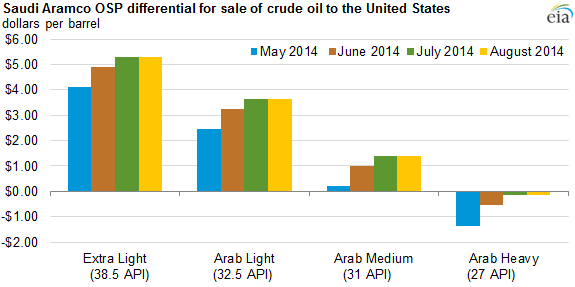
Note: API is a measure of crude quality that reflects how heavy or light a petroleum liquid is compared to water.
In 2013, Saudi Arabia produced 9.7 million barrels of crude oil per day with a total liquid fuels production of 11.6 million barrels per day, ranking it the second-largest producer in the world after the United States. Saudi Arabia exported more than 1.3 million barrels of oil per day to the United States in 2013, which represented 17% of total U.S. crude oil imports.
Principal contributor: Joseph Ayoub
Tags: crude oil, liquid fuels, prices, Saudi Arabia