Railroad deliveries continue to provide the majority of coal shipments to the power sector
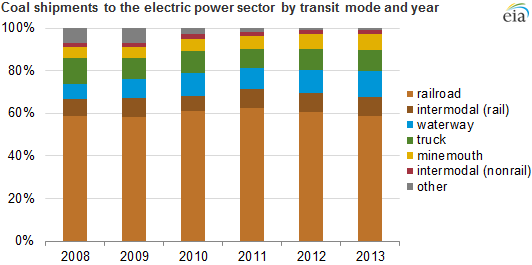
Note: Sum of components may not equal 100% because of independent rounding. Other includes Pipeline, Other Waterway, Great Lakes Barge, Tidewater Pier, and Coastal Ports. Data for 2013 are preliminary.
Note: Intermodal transit uses multiple modes of delivery. Intermodal rail includes some movement over railways, while intermodal nonrail signifies multiple modes that do not include railway.
In 2013, electric power generators consumed 858 million tons of coal, accounting for 93% of all coal consumed in the United States and 39% of electric power generation. Two-thirds of the coal (67%) was shipped either completely or in part by rail. The balance was moved by river barge (especially over the Mississippi and Ohio rivers and their tributaries), truck, and—for power plants located at the coal mine—by conveyor.
The coal transportation network is most densely concentrated in the eastern portion of the United States. This area contains many relatively small coal mines, most of the country's coal-fired power plants, and also rail infrastructure and suitable waterways. In the western United States, coal mines are often large, and a small number of routes handle large amounts of coal.
The primary mode by which a power plant receives its coal is largely determined by its location and access to the rail system. River barge is the most cost-effective method of transporting large quantities of coal over long distances, but the option is limited to plants located on a suitable river. Transporting coal by rail is more expensive, but two related facts result in its dominant market share of transportation: first, the United States is covered by an extensive railway network; and second, coal is produced in a relatively few parts of the country—predominantly in the Powder River Basin (Wyoming and Montana), the Illinois Basin, and Central and Northern Appalachia—while it is consumed by power plants in 46 of the 48 contiguous states.
By the numbers—how many trains and how much coal?
To better comprehend the amount of coal that a power plant consumes, consider that the largest coal-fired plants in the country receive 1 or 2 unit trains of coal each day. Each train has approximately 115 cars, and each car carries an average of 116 tons of coal. Some plants receive more than 26,000 tons of coal in a single day.
After rail and river barge, the third most common method of receiving coal is by truck. This method, however, is typically employed only by plants that are located relatively close to a coal mine because of the higher cost on a per-ton-mile basis. Those plants that are located directly at or very near a mine can also have their coal delivered by conveyor, but, taken together, truck, barge, and conveyor movements make up less than 30% of the coal shipments in the country.
The prominence of rail has not changed in recent years, although slight fluctuations occur as a result of changes in plant operators' coal supply requirements. These changes are driven by a combination of factors, including recent and expected retirements of coal-fired generators, the installation of sulfur dioxide scrubbers at an increasing number of plants that widens the range of coals a plant may burn, changes in regional coal prices, and competition with natural gas and renewable energy. Although coal consumption in the electric power sector decreased by 18% from 2008 to 2013, and the number of coal-fired generators dropped from 1,445 to 1,285 units during that same period, the share of shipments made either exclusively by rail or with rail as the primary mode has remained effectively unchanged.
Between 2008 and 2013, the share of coal shipments made by river barge increased from 7% to 12%. In contrast, truck shipments fell from 12% to 10%, and shipments made by other modes (i.e., nonriver barge waterways, pipeline, tidewater piers, and coastal ports), fell from 7% to 1%. These changes occurred because many of the plants that received their coal by one of the other modes in 2008 either retired or shifted to another mode.
Principal contributor: Vlad Dorjets
Tags: coal, electricity, transportation