U.S. crude oil imports fall, but share of top three suppliers highest in four decades
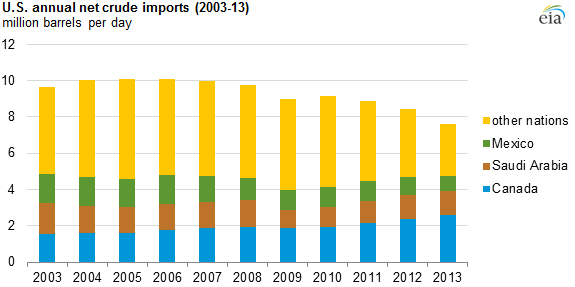
While U.S. total net crude oil imports fell during 2013, the share of imports last year from the United States' top three foreign oil suppliers—Canada, Saudi Arabia, and Mexico—was the highest in at least four decades, according to preliminary annual trade data from EIA's Petroleum Supply Monthly report. These three countries provided almost three out of every five barrels of oil imported into the U.S. market last year.
U.S. net crude oil imports in 2013 declined 10.2% to 7.6 million barrels per day (bbl/d), the lowest level since 1996, as rising domestic crude oil production cut into the volume of imports needed to meet refinery demand for crude oil.
The overall decline in U.S. net imports has led to an increasing concentration of net imports from Canada, Saudi Arabia, and Mexico. Combined net oil imports from these countries decreased by 1.5% last year. As a result, the 4.6 million bbl/d of oil supplied by these three countries accounted for 61% of total U.S. net oil imports in 2013, up from 55% the year before and their biggest share since at least 1973. These countries generally produce medium to heavy, sour crude oil that is desirable to U.S. refineries, while increasing U.S. crude oil production from tight oil formations is typically of the light sweet quality. Also, with the exception of Saudi Arabia, these countries are near the United States, with Mexico having a short shipping distance for its oil to the large number of refineries along the U.S. Gulf Coast.
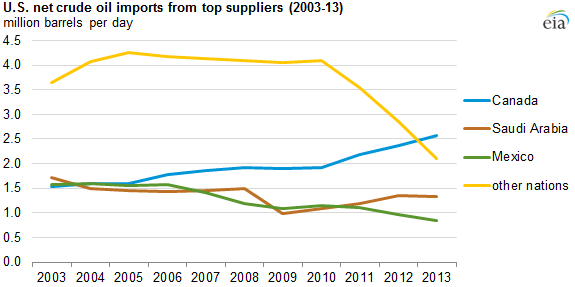
Canada, Saudi Arabia, and Mexico have consistently been America's three largest crude oil suppliers, although their rankings vary from year to year. Highlights from the top three sources for U.S. crude oil imports in 2013:
- Canada. Crude oil imports averaged a record 2.5 million bbl/d, up 3.9% from 2012. Canada has few other outlets for Alberta’s rising heavy crude oil production, so most of it is exported to the United States.
- Saudi Arabia. Crude oil imports averaged 1.3 million bbl/d, down 2.6%, but still the second highest in five years. Through its Motiva Enterprises joint venture, the country's state oil company is a partial owner of three large U.S. Gulf Coast refineries that it partially supplies with Saudi crude.
- Mexico. Crude oil imports of 850,000 bbl/d were down 13% and the lowest in more than 20 years, reflecting the continued decline in Mexico's crude oil production. Still, Mexico produces significant amounts of heavy crude that is well-suited to run in U.S. Gulf Coast oil refineries.
Principal contributor: Tom Doggett
Tags: Canada, crude oil, exports/imports, Mexico, Saudi Arabia