U.S. Energy Information Administration logo
Skip to sub-navigation
April 2, 2014

Net energy imports in 2013 lowest in more than 20 years
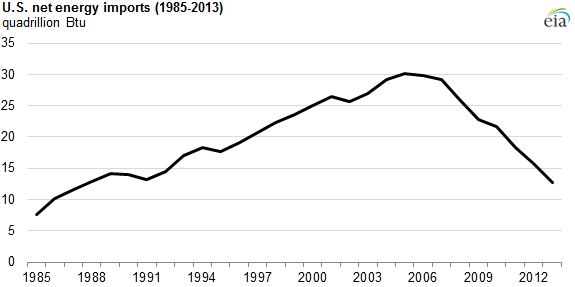
graph of U.S. net energy imports, as explained in the article text
Source: U.S. Energy Information Administration, Monthly Energy Review

Total U.S. net imports of energy, measured in terms of energy content, declined in 2013 to their lowest level in more than two decades. Growth in the production of oil and natural gas displaced imports and supported increased petroleum product exports, driving most of the decline. A large drop in energy imports together with a smaller increase in energy exports led to a 19% decrease in net energy imports from 2012 to 2013.
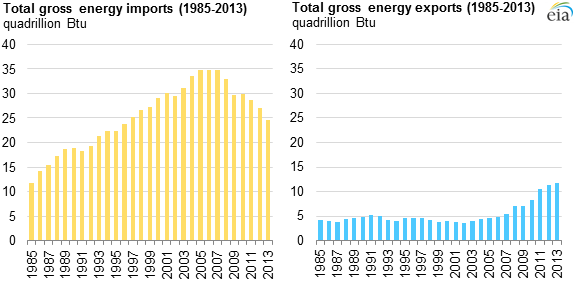
graph of total primary energy imports and exports, as explained in the article text
Source: U.S. Energy Information Administration, Monthly Energy Review

Total energy imports declined faster—down 9% from 2012 to 2013—than in the previous year, while export growth slowed. Crude oil production grew 15%, about the same pace as in 2012, which led imports of crude oil to decrease by 12%, accounting for much of the overall decline in imports.

These data reflect only the energy content of energy trade. For more information on the value of energy trade, see a previous series of Today in Energy articles that examines energy trade in the context of overall U.S. trade in goods and services.

Preliminary 2013 data for U.S. total energy consumption, production, and trade, now available in the Monthly Energy Review, reflect the cumulative effect of changes in energy markets over the year. Other highlights include:

  • Total U.S. primary energy consumption increased 2.4% after declining in 2011 and 2012, with renewable energy providing the largest percentage increase.
  • Primary energy consumption increased in all end-use sectors. Residential sector consumption increased the most, and transportation sector consumption increased the least.

Principal contributor: Mary Joyce

Statistics
Analysis
Tools
Education
News

Petroleum & Other Liquids

Crude oil, gasoline, heating oil, diesel, propane, and other liquids including biofuels and natural gas liquids.

Natural Gas

Exploration and reserves, storage, imports and exports, production, prices, sales.

Electricity

Sales, revenue and prices, power plants, fuel use, stocks, generation, trade, demand & emissions.

Coal

Reserves, production, prices, employment and productivity, distribution, stocks, imports and exports.

Nuclear & Uranium

Uranium fuel, nuclear reactors, generation, spent fuel.

Renewable & Alternative Fuels

Includes hydropower, solar, wind, geothermal, biomass and ethanol.

EIA Survey Forms

Forms EIA uses to collect energy data including descriptions, links to survey instructions, and additional information.

Total Energy

Comprehensive data summaries, comparisons, analysis, and projections integrated across all energy sources.

U.S. States

State energy information, including overviews, rankings, data, and analyses.

International

International energy information, including overviews, rankings, data, and analyses.

Environment

Greenhouse gas data, voluntary reporting, electric power plant emissions.

Data Tools, Apps, & Maps

Tools to customize searches, view specific data sets, study detailed documentation, and access time-series data.

Open Data

EIA's free and open data available as API, Excel add-in, bulk files, and widgets

EIA Beta

Come test out some of the products still in development and let us know what you think!

Open Source Code

EIA's open source code, available on GitHub.

RSS Feeds

Subscribe to feeds for updates on EIA products including Today in Energy and What's New.