Natural gas storage capacity up 2% in 2013 led by West, salt capacity in Producing region
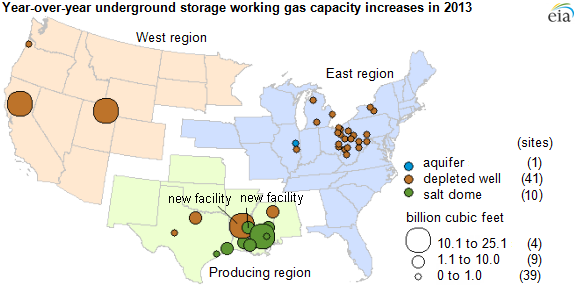
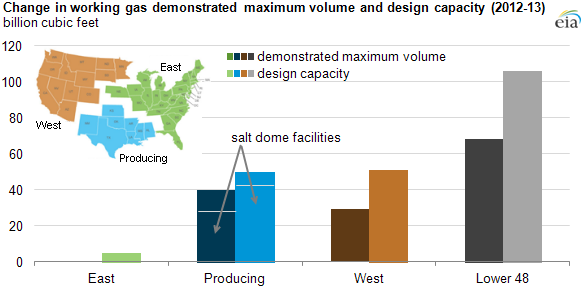
U.S. natural gas storage capacity grew 2% in 2013, according to a report just released by EIA, led by strong gains in salt-based storage in the traditional Producing region as well as in nonsalt storage fields in the West. In contrast, there was almost no growth in storage capacity in the East. Each measure of aggregate storage capacity tracked by EIA, demonstrated (peak volume of gas actually injected into active storage facilities) and design (physical storage capacity), increased by 2% from 2012.
The 2013 storage capacity data show a continuation of a longer-term trend of increasing capacity in the West and Producing regions. For the rolling five-year period ending November 2013, demonstrated salt capacity in the Producing region increased 6.5% to 395 billion cubic feet (Bcf) while demonstrated capacity in the West increased 4.7% to 645 Bcf, compared with the five-year period ending November 2012. This increased the total demonstrated maximum working gas volume in the Lower 48 states by 1.6% to 4,332 Bcf over this time period.
Demonstrated maximum working gas volume is a practical measure of how much gas can be stored for later use. This measure is calculated as the sum of peak volumes actually injected into those facilities, regardless of when the individual peaks occurred over the five-year period. EIA's data on demonstrated capacity come from monthly surveys of storage operations. For demonstrated capacity, the reason for using a rolling period is to capture the actual peaks that likely would not occur simultaneously across all 407 active facilities.
Working gas design capacity is an engineering measure of the estimated maximum volume of working gas that physically can be stored in an underground facility given its design specifications, physical characteristics, compression equipment, temperature, and pressure at a point in time. As of November 2013, salt-based capacity in the Producing region had grown 10.3% from its November 2012 level, while the Producing nonsalt capacity in the region rose only 0.8% over the same period. Unlike other types of storage facilities, salt cavern storage is capable of rapid cycling and can be filled and drawn many times over the course of a year. This rapid cycling capability of injections and withdrawals led the Producing region to an average increase of 3.3% to 1,572 Bcf. Over the same period, the West rose 6.8% to finish at 804 Bcf. The East rose only slightly, by 0.2%, to 2,305 Bcf.
Demonstrated Maximum Working Gas Volume |
Working Gas Design Capacity | Demonstrated Maximum Working Gas Share of Working Gas Design Capacity | |||||||
|---|---|---|---|---|---|---|---|---|---|
Region |
Dec 2007- Nov 2012 |
Dec 2008- Nov 2013 |
Percent Change |
Nov 2012 |
Nov 2013 |
Percent Change |
Nov 2012 |
Nov 2013 |
|
East |
2,201 |
2,201 |
0.0% |
2,300 |
2,305 |
0.2% |
95.7% |
95.5% |
|
Producing |
1,447 |
1,487 |
2.8% |
1,522 |
1,572 |
3.3% |
95.1% |
94.6% |
|
| Salt | 371 |
395 |
6.5% |
407 |
449 |
10.3% |
91.2% |
88.0% |
|
| Nonsalt | 1,077 |
1,091 |
1.3% |
1,114 |
1,123 |
0.8% |
96.7% |
97.2% |
|
West |
616 |
645 |
4.7% |
753 |
804 |
6.8% |
81.8% |
80.2% |
|
Lower 48 |
4,264 |
4,332 |
1.6% |
4,575 |
4,681 |
2.3% |
93.2% |
92.5% |
|
Most of the currently planned storage projects are in the Producing salt and West regions. Completion of these storage projects in 2014 could increase design capacity by 63 Bcf, including 50 Bcf from facilities currently under construction. New salt facilities currently under construction in the Producing region account for 22 Bcf of the additional working gas capacity. In the West, completion of new facilities could increase design capacity by 28 Bcf. An additional 13 Bcf of new capacity is also planned at existing facilities in 2014.
Principal contributors: Jose Villar, John Jennrich
Tags: capacity, natural gas, storage, storage