New England spot natural gas prices hit record levels this winter
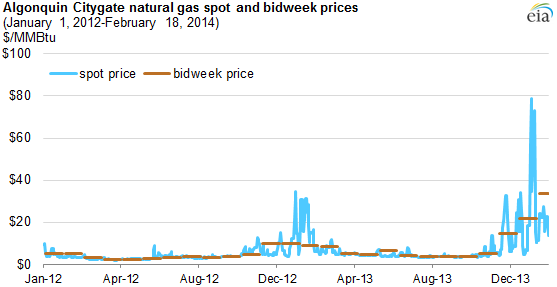
Note: Spot prices by trade date. Bidweek prices are determined during the final three trading days of the prior month.
Republished February 21, 2014, 8:37 a.m., to clarify text in the second paragraph.
From January 1 to February 18, the day-ahead wholesale (spot) natural gas price at the Algonquin Citygate hub serving Boston averaged $22.53 per million British thermal units (MMBtu), according to data from IntercontinentalExchange (ICE). This price is a record high for these dates since the ICE data series began in 2001, and 50% above the same period in 2013, when cold weather drove New England prices to their highest level since 2004.
The average bidweek (the last three trading days of the month for the prompt month contract) price for natural gas delivered at Algonquin in February 2014 also reached a record high of $33.79/MMBtu. These high winter prices in New England resulted from a combination of increased weather-driven demand for natural gas and constraints on the supply of gas to consumers there.
Average 2014 daily consumption of natural gas in New England through February 18 has risen by 4.7% over the same period in 2013, from 4.4 billion cubic feet per day (Bcf/d) to 4.6 Bcf/d. Higher demand has pushed up prices in both the spot and futures markets.
Two key supply-related factors have contributed to higher regional prices. First, deliveries of regassified liquefied natural gas (LNG) from Northeast terminals are down more than 30% so far in 2014 compared to the same period in 2013. Second, major pipelines transporting natural gas into New England have been congested. An expansion of the pipeline system could ease pipeline constraints, but the cost-effectiveness of pipeline expansion projects (including their ultimate costs to consumers) remains a challenge.
The U.S. Energy Information Administration recently released a report on possible alternatives to pipeline expansions into New England as part of a new natural gas web page that presents current issues and trends that affect natural gas markets.
Principal contributors: Mike Ford, Chris Peterson