
Current drought reduces hydro generation forecast for California
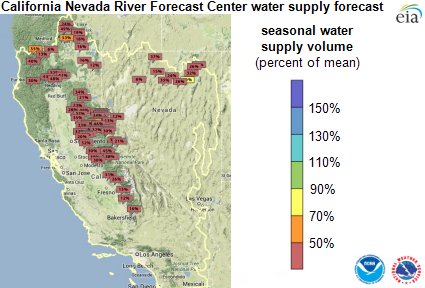
Note: Forecasts as of January 22, 2014.
Note: Click to enlarge.
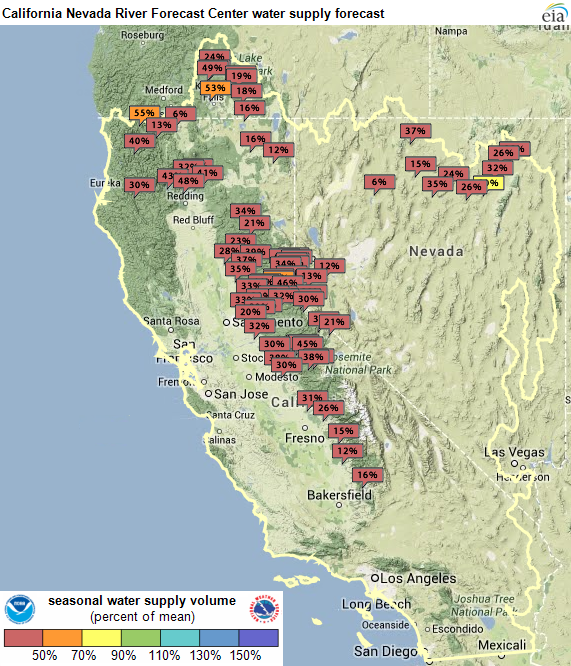
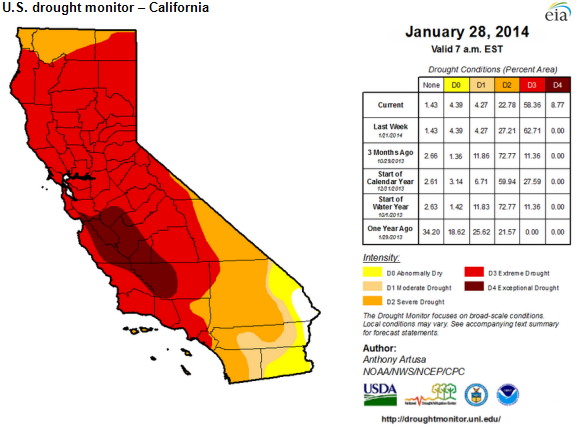
Forecasts for the water supply at nearly every major water gauge in the states of California and Nevada were less than half of average seasonal norms as of February 5. The water supply situation has not materially improved since the governor of California declared a state of emergency on January 17. Several dry years have left California dealing with low water supply. The driest December on record has resulted in nearly 60% of the state now classified as being in a condition of extreme drought, the second-worst category in the U.S. drought monitor index.
According to the California Department of Water Resources, snowpack (an indication of how much water will be available to fill reservoirs and power hydroelectric generators throughout the year) in the northern Sierra Nevada range is about one-fifth of normal for the hydrological year that runs from October 2013 through September 2014.
Almost 14% of the nation's hydroelectric generating capacity is concentrated in California. Since 1989, hydroelectric dams have accounted for varying portions of electricity generated within California, from 11% in 1992 (reflecting a low water year) to a high of 28% in 1995 (a high water year). The chart below also shows the level of California hydro output in the service territory of the California Independent System Operator (CAISO), the electric grid operator for most of the state since 2010. As shown, hydro generation during the past two summers was well below levels attained in the summers of 2010 and 2011. Hydro output peaks in the spring and early summer as melted snow flows through the river basins. Overall demand for electricity, however, peaks slightly later, at the height of summer, when air conditioners are running most often.
Absent output from in-state hydroelectric resources, CAISO has tended to import more power from neighboring regions as well as increase output from thermal sources of generation. Much of the imported power comes from hydroelectric dams located in the Pacific Northwest, which is also experiencing low water supply. Tomorrow's Today in Energy article will provide details of the latest Pacific Northwest water supply forecast.
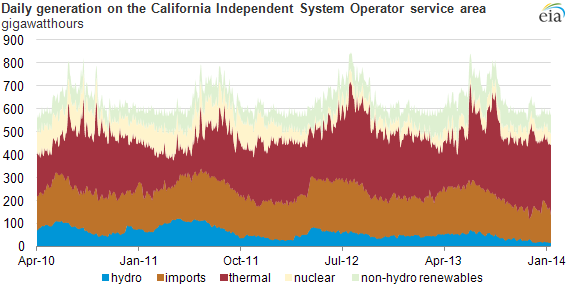
Note: Data above are the five-day, rolling average summation of hourly output.
Principal contributor: M. Tyson Brown