U.S. Energy Information Administration logo
Skip to sub-navigation
February 5, 2014

Global demand, inexpensive natural gas are increasing domestic plastic production
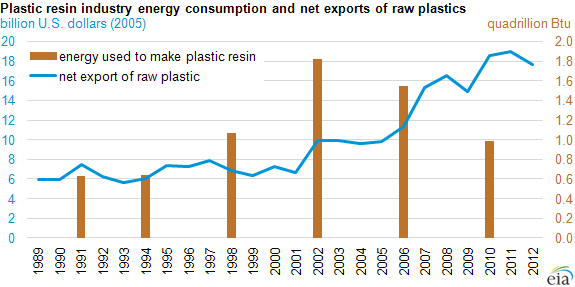
Graph of plastic resin industry energy consumption and net exports of raw plastic, as explained in the article text
Source: EIA, Manufacturing Energy Consumption Survey, and Bureau of Economic Analysis U.S. Trade in Goods (June 2013)

Low U.S. natural gas prices have helped increase domestic plastic production after a decline from the 2008 recession. Because many U.S. plastic manufacturers use natural gas as their primary fuel source and natural gas-sourced liquids as a feedstock, continued low prices for those resources could boost raw plastic exports, given higher foreign energy prices.

The United States supplies raw plastics, sometimes called resins, to domestic makers of plastic products, such as food packaging and toys. Raw plastics are also exported. During the economic downturn in 2008 and 2009, U.S. production of plastic products declined further than raw plastic production, and has been slower to recover. Demand for raw plastic from other parts of the world, such as China, remained strong, keeping U.S. plastic resin production from falling further and enabling it to recover faster. Given the inexpensive and versatile nature of polyethylene and polypropylene plastics, demand for these plastics grew rapidly since the late 1990s, both domestically and abroad.

The plastics industry includes the production of bulk plastic resin (often as pellets) as well as the production of plastic products that are sold commercially, such as milk jugs and toys. Plastic resin production is one of the largest energy consumers in the manufacturing sector, estimated to consume almost a quadrillion British thermal units (Btu) in 2010 for fuel and non-fuel uses, and providing nearly $84 billion of shipments in the U.S. economy in 2011. The energy required to make plastics has decreased markedly since 2002, suggesting some efficiency improvements in plastic production, along with structural changes, such as new products or technological advances.
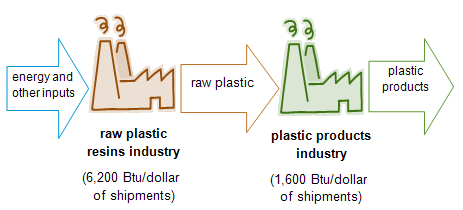
chart of plastics production process, as explained in the article text

Principal contributor: Elizabeth Sendich

Statistics
Analysis
Tools
Education
News

Petroleum & Other Liquids

Crude oil, gasoline, heating oil, diesel, propane, and other liquids including biofuels and natural gas liquids.

Natural Gas

Exploration and reserves, storage, imports and exports, production, prices, sales.

Electricity

Sales, revenue and prices, power plants, fuel use, stocks, generation, trade, demand & emissions.

Coal

Reserves, production, prices, employment and productivity, distribution, stocks, imports and exports.

Nuclear & Uranium

Uranium fuel, nuclear reactors, generation, spent fuel.

Renewable & Alternative Fuels

Includes hydropower, solar, wind, geothermal, biomass and ethanol.

EIA Survey Forms

Forms EIA uses to collect energy data including descriptions, links to survey instructions, and additional information.

Total Energy

Comprehensive data summaries, comparisons, analysis, and projections integrated across all energy sources.

U.S. States

State energy information, including overviews, rankings, data, and analyses.

International

International energy information, including overviews, rankings, data, and analyses.

Environment

Greenhouse gas data, voluntary reporting, electric power plant emissions.

Data Tools, Apps, & Maps

Tools to customize searches, view specific data sets, study detailed documentation, and access time-series data.

Open Data

EIA's free and open data available as API, Excel add-in, bulk files, and widgets

EIA Beta

Come test out some of the products still in development and let us know what you think!

Open Source Code

EIA's open source code, available on GitHub.

RSS Feeds

Subscribe to feeds for updates on EIA products including Today in Energy and What's New.