Change in energy prices mixed in 2013 as prices of nonenergy commodities fell
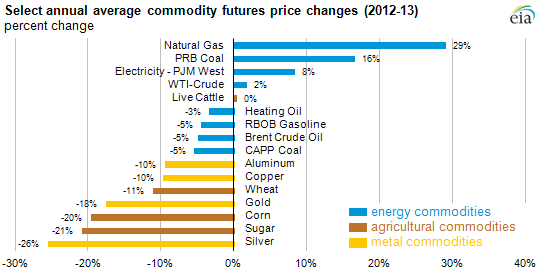
Note: Price changes are derived by taking the difference in annual average prompt contract price for each commodity for all trading days in 2012 and 2013. This method allows for comparisons of different commodity classes on a consistent basis. PRB Coal is Powder River Basin Coal. CAPP Coal is Central Appalachia Coal. WTI is West Texas Intermediate, a benchmark for both physical and financial crude oil pricing located in Cushing, Oklahoma. RBOB Gasoline is a kind of gasoline based on a reformulated blendstock for oxygenate blending (RBOB).
During 2013, the prices of various energy commodities increased from 2012 levels or were down modestly as prices of nonenergy commodities generally fell significantly. Prices for natural gas, western coal, electricity, and WTI crude were all higher (on average) in 2013 than in 2012, while the price of North Sea Brent crude oil, various petroleum products, and eastern coal all dropped.
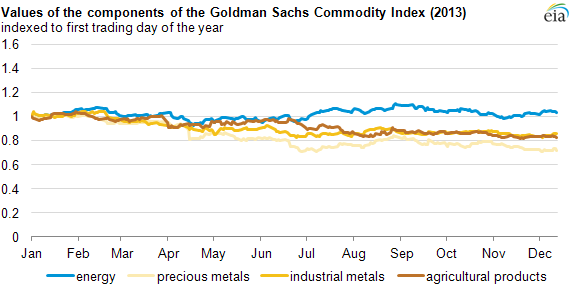
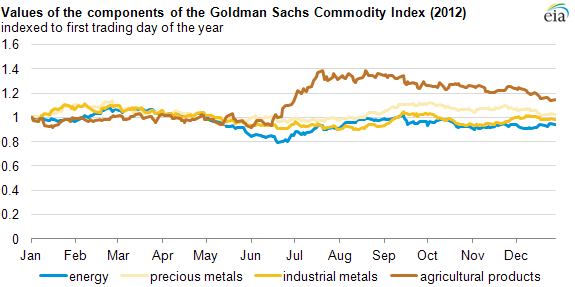
In total, the divergence between price trends for energy and nonenergy commodities grew after the summer of 2013 (see first tab below). This is in contrast to 2012 when metals prices were stable or experienced slight increases, and a severe drought drove prices of some agricultural commodities higher in the second half of the year (see second tab below). In 2013, the energy component of the S&P Goldman Sachs Commodity Index (GSCI) ended the year close to its starting point. The S&P GSCI Grains, Industrial Metals, and Precious Metals indexes, on the other hand, ended 2013 down 17%, 20%, and 27% from their respective starting points.
Source: U.S. Energy Information Administration based on Bloomberg, L.P.
Note: Values are indexed to the first trading day of each year. The fifth component of the S&P GSCI Index, Livestock, is not shown in the graph.
Source: U.S. Energy Information Administration based on Bloomberg, L.P.
Note: Values are indexed to the first trading day of each year. The fifth component of the S&P GSCI Index, Livestock, is not shown in the graph.
In recent years, crude oil futures price changes often moved in tandem—were positively correlated—with the price changes of other commodities. These correlations dropped in the latter half of 2013, indicating that commodity sector prices have been responding to factors in their respective markets rather than broad shifts in expectations of global economic growth, which tend to increase or decrease the prices of all commodities.
During the next few days, Today in Energy articles will focus on key energy commodity price trends in 2013. Below, changes in select energy and nonenergy commodity futures prices are discussed, some of which are included in the Goldman Sachs Commodity Index, others of which are added to provide a broader coverage of energy markets.
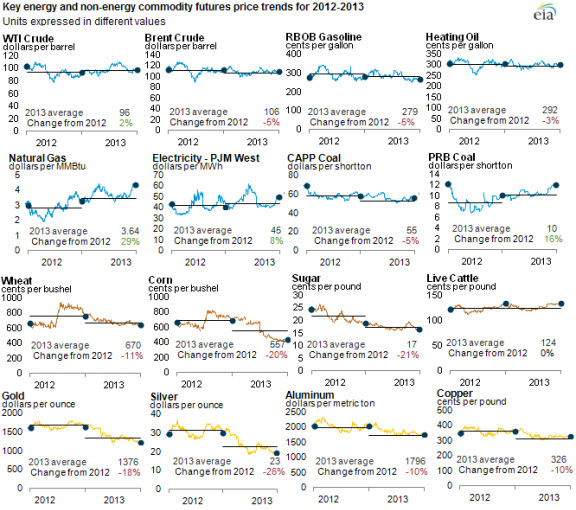
Note: Horizontal lines represent annual average prices, dots represent annual end points. All data are near-month futures contracts. Commodity choices were based loosely on the Goldman Sachs Commodity Price Index and adjusted for greater coverage of energy commodity trends.
Energy Commodities
Prices for major crude oil benchmarks and petroleum products ended the year mostly flat or down. WTI and Brent together make up nearly 70% of the weighting in the S&P GSCI Energy Index. The index was heavily influenced by the rise in crude prices during the initial supply disruptions in Libya in July and the uncertainty of military conflict in Syria in the last half of August. However, as fall maintenance season began in the United States, pushing WTI inventories near record highs, and as geopolitical issues subsided, crude prices declined. Petroleum products and natural gas account for the remaining 30% of the S&P GSCI Energy Index. Heating oil prices rose this year because of strong global demand for distillate fuel and inventories near five-year lows. Gasoline prices, however, declined as abundant supplies were produced as a result of the high refinery runs needed to satisfy demand for heating oil and diesel fuel.
U.S. natural gas prices ended higher in 2013 as cold weather across much of the country drove prices well above $4 per million British thermal units ($/MMBtu) in both the physical and financial markets. As a result, natural gas prices were 50 cents to $1/MMBtu above their level at the start of the year.
Throughout the week, several regional price patterns in both natural gas and electricity markets will be discussed in articles on each energy sector. Eastern coal from the Central Appalachian Basin, not a component of the S&P GSCI Energy Index, ended the year basically flat, which stands in contrast to the increase seen in the price of coal from Powder River Basin, mined in the western United States.
Grains Commodities
The S&P GSCI Grains index, a subindex of the larger Agriculture Index, includes corn, wheat, and soybeans, with corn accounting for just over 40% of the weighting. Corn prices declined sharply this year because of better-than-expected crop yields from favorable weather conditions during harvest season, leading a drop in the grains subindex in the last half of the year. The U.S. Department of Agriculture estimated that the 2013 corn crop production reached almost 14 billion bushels, the highest recorded, with an average corn crop yield of 160.4 bushels per acre, the second-highest yield recorded.
Metal Commodities
The S&P GSCI Industrial Metals Index is composed mostly of copper and aluminum, which make up 80% of the index. Copper prices declined in 2013 because of concerns that economic growth in large commodity-consuming countries, like China, is slowing, resulting in reduced demand. In addition, copper inventories, as tracked by the London Metal Exchange, increased from the beginning of 2013, peaking in the summer months, placing downward pressure on prices. The S&P GSCI Precious Metals Index had the largest decline out of these four indexes because of the decline in the price of gold, which accounts for 85% of the index.
Principal contributors: Rebecca George, M. Tyson Brown
Tags: coal, crude oil, liquid fuels, natural gas, oil/petroleum, prices