
Abundant 2013 corn harvest boosts ethanol production
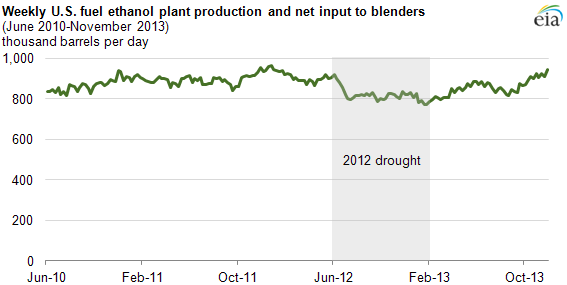
Expectations for a record corn harvest in 2013 have helped lower corn prices since this summer, improving ethanol production margins and spurring an increase in the supply of ethanol.
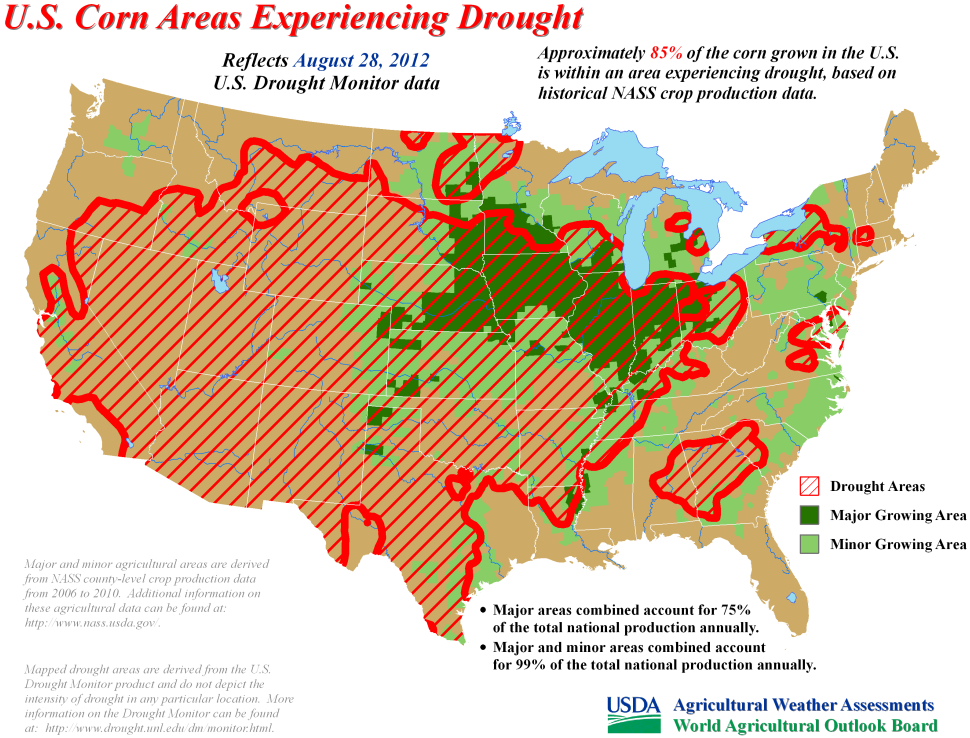
During the 2012 corn-growing season, the United States experienced the most severe and far-reaching drought since the 1950s. By late August 2012, approximately 85% of the corn grown in the United States was located in a drought area, according to U.S. Department of Agriculture's (USDA) World Agricultural Outlook Board. A projected 2012 record crop of 14.8 billion bushels of corn dwindled to a final production level of 10.8 billion bushels by the end of last year's harvest period.
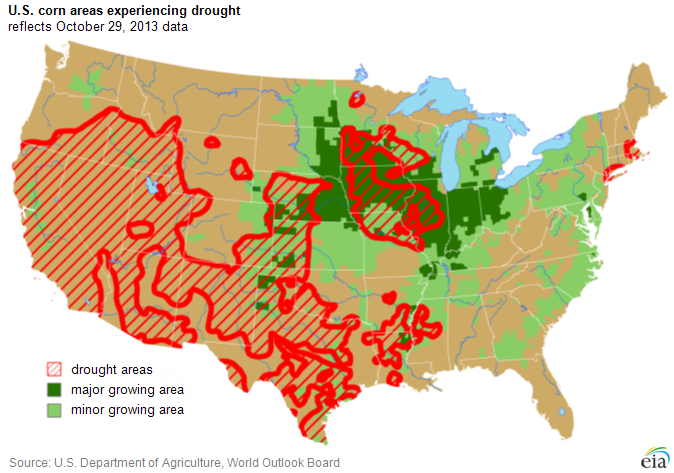
Abundant snow and rainfall in late winter and early spring revived prime corn-growing land. For 2013, the USDA is predicting a record-high corn crop of 14.0 billion bushels, a 30% increase over 2012. Much of the United States is still experiencing drought in 2013, but large portions of the Midwest avoided prolonged drought during the critical growing months.
The ethanol margin, the difference between the market price of ethanol and its cost of production adjusted by the value of co-products, is a measure of the profitability of producing ethanol. Between October 2012 and January 2013, the ethanol margin for producers was close to zero. The recent reduction in corn prices had a major impact on the profitability of ethanol production, because purchased corn is by far the largest cost incurred by ethanol producers. On average, one bushel of corn can be used to produce 2.8 gallons of ethanol.
Between January and November 2013, corn prices fell from about $7.50 per bushel to below $4.50 per bushel. A $3 reduction in the price of a bushel of corn translates into a roughly $1.08 reduction in the cost of ethanol production. While ethanol prices have also declined, ethanol producer margins have risen above $0.50 per gallon in recent months.
Improved margins have incentivized greater levels of ethanol production, with output recovering to pre-drought levels. At the same time, lower prices have made ethanol more economically attractive for refinery blending, and output of ethanol-blended gasoline has risen. Net use of ethanol by refiners and blenders reached an all-time high of 884,000 barrels per day in August 2013.
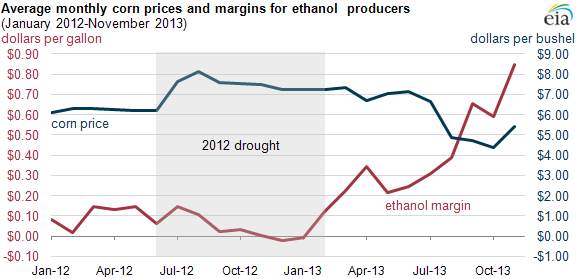
Note: Ethanol margins are a measure of the profitability of producing ethanol. Margins below zero indicate producers would be taking a loss on the production of ethanol, but the individual cost structures of a producer vary widely.
Principal contributors: Irene Olson, Sean Hill