
Propane demand hits a record high for November
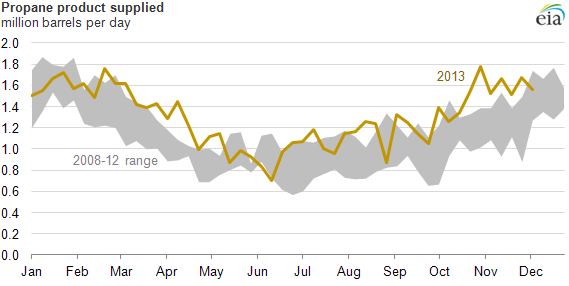
Note: Product supplied is a proxy for consumption.
Republished December 12, 2013, 11:55 a.m. text was modified to clarify content and propane inventories graph was updated.
Propane is produced from natural gas at processing plants and from crude oil at refineries. Propane produced from natural gas has been the fastest-growing component of overall U.S. propane supply. Propane production in the United States has set record highs on an almost weekly basis in 2013 as a result of increased oil and natural gas drilling. A record corn crop harvest has increased the demand for propane (shown in the graph above as product supplied) in the central United States. Expanded propane production met this agricultural demand, while continuing to supply other markets.
A record-setting corn harvest is currently underway in the United States. According to the U.S. Department of Agriculture, corn production is forecast to be a record 14.9 million bushels in 2013-14. Corn must be dried to a 15% moisture content before it can be stored to avoid mold and other quality problems. Because propane is used for crop drying, a wet growing season in the Midwest combined with the largest corn yield in U.S. history has greatly increased the demand for propane. Thus far, Indiana, Iowa, Minnesota, Montana, Nebraska, South Dakota, and Wisconsin have declared states of emergency to allow for more delivery of propane throughout the Midwest.
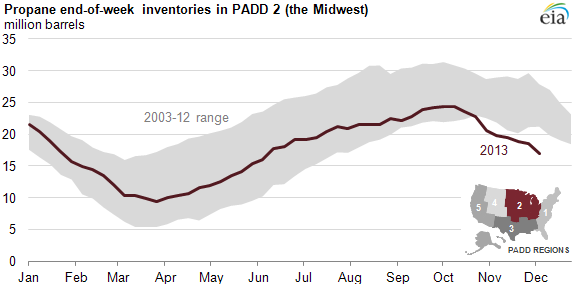
Note: Ending inventories measured at the end of the reporting period.
According to EIA weekly data, demand for propane is currently at the highest level ever recorded for November. For the week ending November 1, the United States consumed nearly 1.8 million barrels per day—a figure typically not seen until January or February, when the winter heating season reaches a peak. As a result, propane inventories in PADD 2 (the Midwest) have fallen to their lowest level for November since 1996. Along with spiking domestic demand, competitively-priced U.S. propane exports have also surged. Exports from the United States are currently estimated to be 288,000 barrels per day, not far from the record of 308,000 barrels per day set in May 2013.
This boost in propane demand has created a spike in propane prices across the country. The winter heating season is just beginning to affect consumption figures, so propane demand for the 2013-14 season could continue at a record pace into the spring.
Principal contributor: Alex Wood