
River disruptions and strikes lower U.S. petroleum product exports to Northwest Europe
Republished November 6, 2013, 9:00 a.m. to correct data in the text.
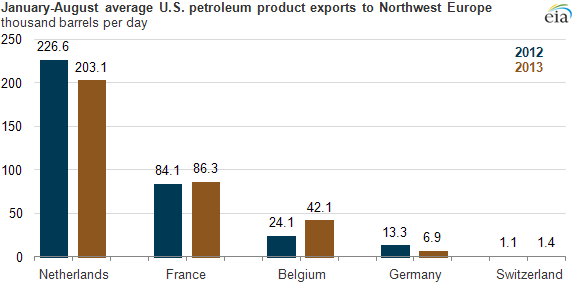
Average exports to the Netherlands, the third largest export destination for U.S. petroleum products, fell by 24,000 barrels per day in the first eight months of 2013 (the latest data available) compared to 2012. The Netherlands ranks among the largest importers of petroleum products in the world; however, International Energy Agency (IEA) statistics indicate that only 27% of such imports are consumed within the country. Recent disruptions to transport networks highlight the key role the Netherlands plays in delivering exported U.S. petroleum products to northwest Europe.
The Netherlands is home to the ports of Amsterdam and Rotterdam. Together with Antwerp in Belgium, these ports host large petroleum product import, storage, and distribution terminals from which multiple countries in Europe can be supplied using canals and river transport. Rotterdam alone has almost 80 million barrels of crude oil and petroleum product storage capacity. In global petroleum product trade, the three ports are collectively known as ARA (Amsterdam, Rotterdam, Antwerp). The ARA is a pricing point for many petroleum products, including gasoline and diesel fuel. Petroleum products sent to these three ports can be shipped to industrial regions in the Netherlands, Belgium, Luxembourg, Germany, France, and Switzerland using barge transport along the Scheldt, Meuse, and Rhine rivers.
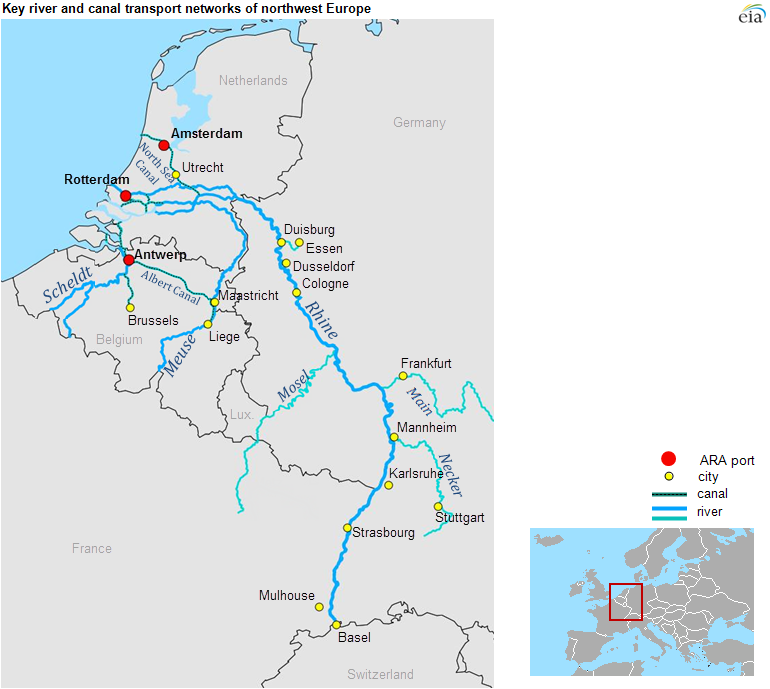
Note: Waterway sections shown are classified as navigable by barges between 1,600-6,000 tons and/or 3,200-18,000 tons.
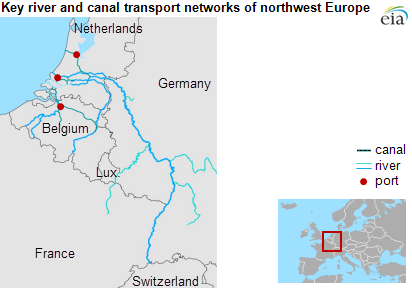
Note: Click to enlarge.
EIA export data, which come from the U.S. Bureau of the Census, include a destination for export shipments, but that destination is not always the final delivery location; it could be just the first stop. The final delivery location for a shipment is available only if it is provided. When the ultimate destination is not specified, an export is credited to the last country in which the product remained in the same form. Therefore, the Netherlands and Belgium appear to import far more petroleum product than what is consumed in those countries. In fact, the ARA is a distribution hub for petroleum products. IEA data from 2010 and 2011, the latest data available, reveal that only 27% of the petroleum products flowing to the Netherlands are consumed there. However, if a petroleum product shipment is arranged from the United States all the way to its final destination, the destination is listed and credited with the import, allowing landlocked Switzerland to appear in U.S. export data.
In the early months of 2013, heavy spring rains caused widespread flooding along the Rhine River, and portions of the river were closed to barge traffic. In the summer months, low river levels forced barges to carry lighter cargos to ensure safe transit. Throughout early summer, strikes by German canal operators caused barge traffic to back up along the Rhine River.
These disruptions resulted in lower U.S. petroleum product exports to Netherlands (-11%) and Germany (-46%) in the first eight months of 2013 compared to the same period in 2012. Some of the drop in exports to the Netherlands can be attributed to the disruptions in Germany and the Rhine because of the way data are collected and products are first transported through the Netherlands. Belgium, which was relatively unaffected by the disruptions, imported 88% more petroleum products from the United States in the first eight months of 2013 compared to the same period last year. Exports to France, which has other large ports and transport routes, remained roughly unchanged (+2%) from 2012.
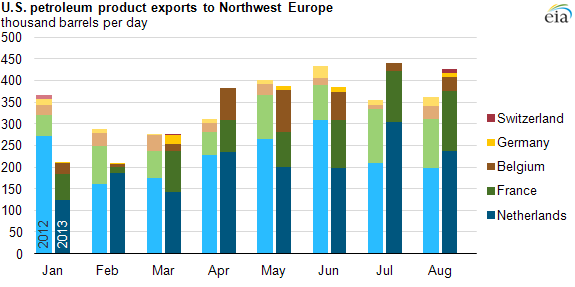
Additional factors that have influenced petroleum product flows to northwest Europe include weakened demand for petroleum products and increased imports of petroleum products from Russia.
Other regions are offsetting the drop in U.S. exports to northwest Europe, particularly Central and South America. Brazil, Chile, and Panama are next after the Netherlands as the fourth, fifth, and sixth largest destinations for U.S. petroleum product exports.
Principal contributor: T. Mason Hamilton
Tags: exports/imports, international, liquid fuels, map, oil/petroleum