Production, depletion trends are keys to predicting natural gas and oil production
Note: Click to enlarge.
Republished November 12, 2013, 11:16 a.m. to correct an error in the text.
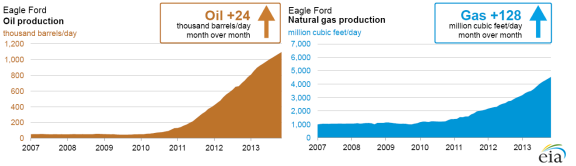
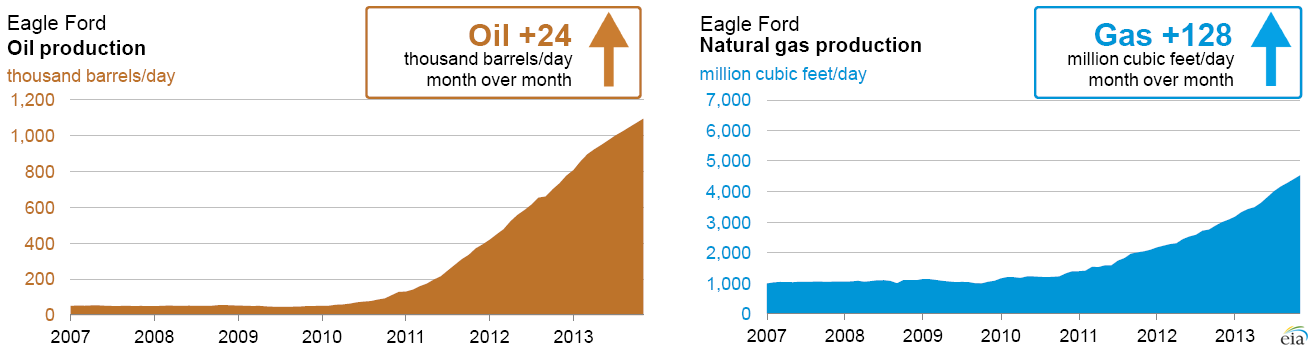
An accurate estimate of oil and natural gas production takes into account the volumes of new production from recently drilled wells coupled with the effects of declining production from existing wells, without distinctions for drilling rigs or wells that are specifically targeted for oil or natural gas. The Drilling Productivity Report (DPR), recently released by the Energy Information Administration, uses this approach.
Note: Click to enlarge.
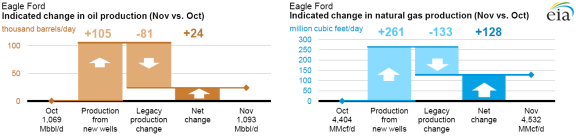
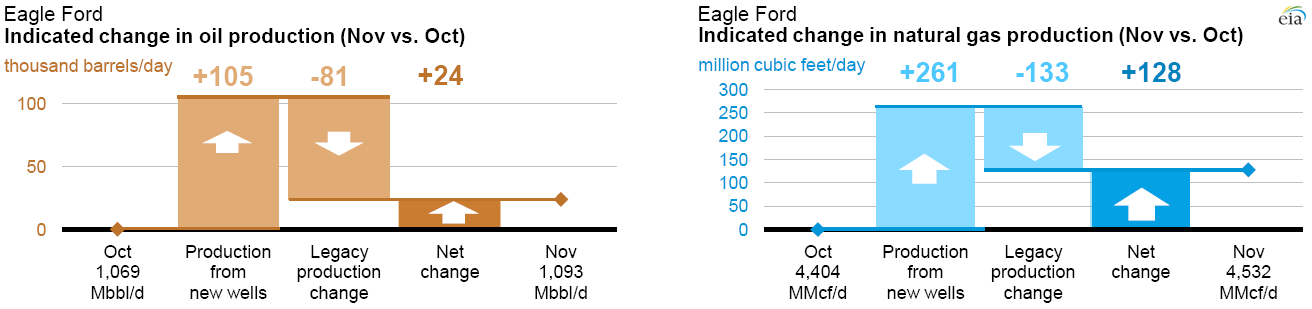
The change in production volumes from one month to the next illustrates the positive and negative forces that affect production volumes in a given region. EIA estimates the month-to-month change in production by:
- First summing the prior month's production and expected production from new wells in their first full month of production
- Then adding the expected change in the region's production from all other wells. This is the legacy production change, which is typically negative because well production naturally declines over time.
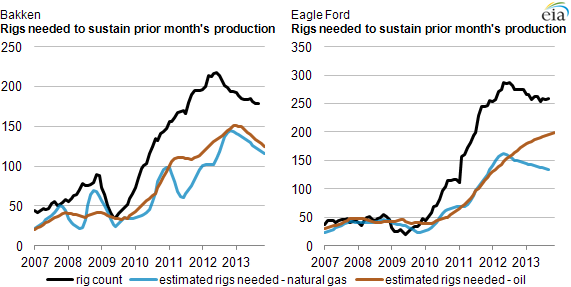
Understanding the positive and negative forces that affect production volumes in a given region allows the estimation of the number of rigs required to make up for the natural loss of production from existing wells. This measure of production declines and potential increases helps when evaluating the number of rigs in a region and their potential effect on production volumes.
Considering new and existing wells separately helps to highlight regions where the growing number of relatively new wells leads to large monthly declines in legacy production, putting more pressure on increasing production from new wells in order to keep net output rising.
The productivity gains and the current rig count in the Eagle Ford and Permian regions comfortably offset the current decline rates. The recent emergence of production growth in the Niobrara and Permian, along with strong continued growth in the Eagle Ford, is evidence that tight oil production will continue to drive production growth in the United States.
A series of previous Today in Energy articles discussed individual metrics included in the DPR and explained their relationship to traditional drilling productivity measures.
Principal contributors: Jozef Lieskovsky, Sam Gorgen