Rethinking rig count as a predictor of natural gas production
Note: Natural gas production includes volumes that after being produced may be vented, flared, reinjected, separated, or otherwise processed; this is also known as produced natural gas or gross withdrawals.
Republished October 28, 2013, 3:45 p.m., text was modified to clarify content.
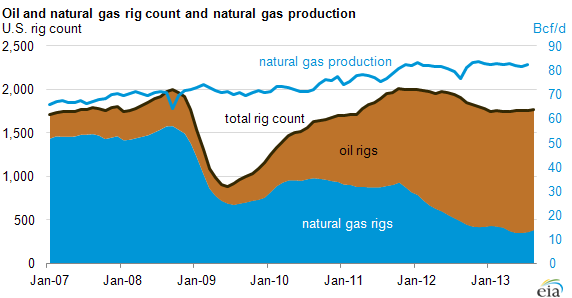
In the past, the number of gas-oriented drilling rigs in a particular region has been a common metric for estimating the production of natural gas. However, technological advances have led the way to the widespread use of new oil and natural gas extraction techniques that have opened up a hydrocarbon resource base dramatically larger than previous estimates. Because of these new methods of extraction, generally in wide use since 2007, natural gas production has steadily risen, while the number of active rigs characterized as targeting natural gas has fallen dramatically.
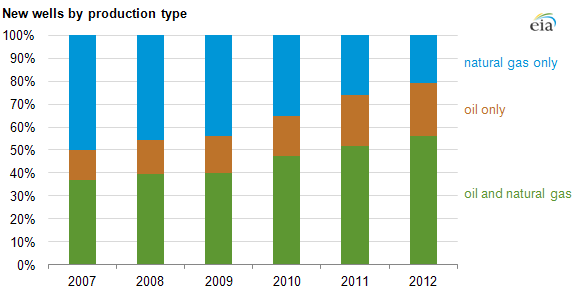
The number of wells drilled nationwide that have produced both oil and natural gas increased from 37% in 2007 to 56% in 2012 (see chart below). This increase helps explain why natural gas production can rise (as it has) even as the number of rigs characterized as drilling for natural gas has fallen.
Using historical data (starting from 2007, corresponding to large-scale adoption of horizontal drilling and multistage hydraulic fracturing by industry), EIA developed a process model to estimate production trends and volumes in six major shale plays, which is one part of EIA's monthly drilling productivity report (DPR).
The DPR combines rig count data with well production data to calculate variables such as:
- Drilling efficiency (the number of wells drilled per rig per month)
- Lag times between drilling and the start of production
- Production declines from existing wells
- Initial rates of oil and natural gas production per well
- Expected new production per drilling rig observed
The DPR also includes a forecast of production through the month following the report release.
To estimate production for the most recent months, DPR uses the total observable rig count, along with recent trends in the key relationships between drilling and production. Using the expected productivity from all drilling rigs to estimate the oil and gas production coming from all resultant wells improves upon simple rig count models. Specifically, it does not break drilling into categories based on drilling targets (oil or gas), well type (vertical, directional, horizontal), or operator. The most relevant information for the DPR comes from the total number of rigs drilling, where those rigs are drilling, and the average efficiency and productivity of those regions.
Tomorrow's Today in Energy article will focus on the importance of reporting oil and natural gas activity together in the DPR.
Principal contributors: Jozef Lieskovsky, Sam Gorgen