Oil futures price curve has steepened over the past six months
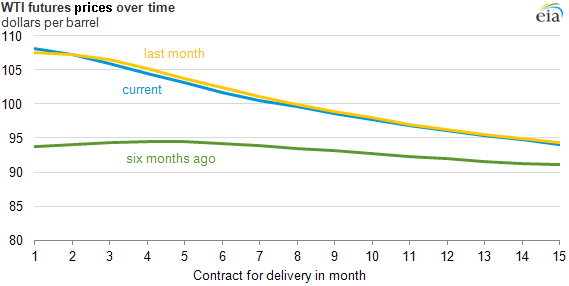
Note: The prices above are end-of-day prices for September 18, August 16, and March 18, 2013. The x-axis reflects the number of months later than the spot market. Contract for delivery in month 1 would be the contract for October 2013 for the current futures curve.
Crude oil futures contracts allow crude to be bought and sold for delivery at specific dates in the future, meaning market participants can lock in a price today for the future delivery of a barrel of oil. Over the past six months, the price of West Texas Intermediate (WTI) oil has increased, but the prices of futures contracts for WTI further into the future have remained fairly flat.
The front month futures contract labeled contract 1 in the chart above reflects short-term supply, demand, and transportation dynamics. The price for contracts delivered further into the future can be used as an indicator of longer term supply and demand expectations. Costs to store oil, opportunity costs associated with long-term market positions, as well as general uncertainty in the market all tend to push prices in future months above contracts at closer delivery, reflecting the premium for this product.
Higher prices for near-term contracts compared to prices for contracts with later delivery dates (meaning prices are expected to fall in the future) is a phenomenon called backwardation. Conversely, higher prices for delivery dates further in the future are said to be in contango.
The current steep backwardation on the chart above can be attributed to several factors:
- Recent geopolitical events, supply disruptions, and high seasonal refinery demand have driven up the price of the front month contract.
- The problems of pipeline infrastructure to transport oil out of Cushing, Oklahoma—a major oil storage hub—have not been fully resolved. The futures market indicates that market participants expect some bottlenecks to persist, which contributes to lower WTI futures prices and drawing from inventories that reached record highs last year.
- The futures market indicates expectations that U.S. oil production, particularly from low permeability (tight) formations, will increase in future years, contributing to downward pressure on the WTI price. EIA's latest Short-Term Energy Outlook (STEO) forecasts U.S. total crude oil production to average 8.4 million barrels per day in 2014, 1.9 million barrels per day higher than in 2012.
Over the summer, the factors described above pushed up the front month price relative to later months (see graphs below).
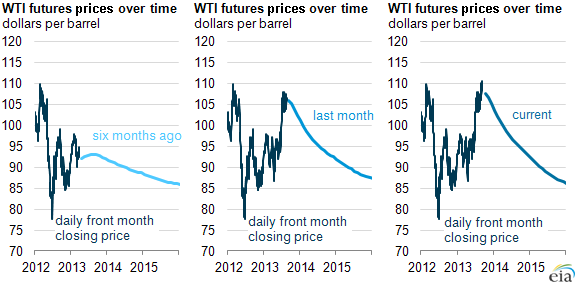
Note: The dark blue lines show the daily front month closing prices through September 18 (current), August 16 (last month), and March 18 (six months ago), and the light blue lines show the shape of the futures curve on those days.
The fact that the market is backwardated reflects the market's anticipation that most of the recent international geopolitical factors will be temporary. The market expects the longer term fundamental production and transportation issues described above to remain, which contributes to lower WTI prices.
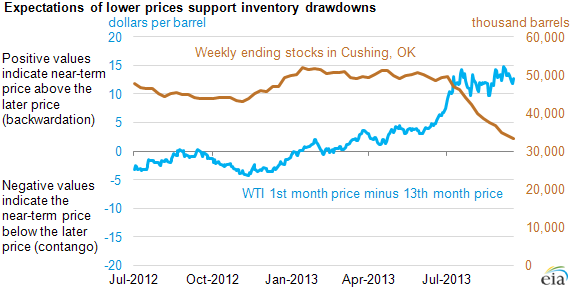
Another commonly used way to gauge the difference between near-term and longer-term oil contract prices is to compare the difference between the 1st and 13th month prices, referred to as the 1st-13th month spread. The 1st-13th month spread for WTI crude oil has steepened since last year and grown at a particularly high rate over the last month, with the spread reaching an all-time high of $14.78 on September 6 (see chart below). Backwardation incentivizes selling off inventory because spot prices are higher.
The futures market illustrates expectations of longer term supply and demand of crude oil given current information. The New York Mercantile Exchange (Nymex) has WTI delivery contracts for every month through 2018, and every June and December through 2021. The volume of contracts traded much further into the future, however, is sparse relative to the volume of those traded for earlier delivery. Longer dated futures contract prices are subject to significant changes from current trading levels as more participants begin buying and selling their contracts and information regarding future supply and demand arises. Additional information on futures markets and other aspects of market uncertainty is provided in the monthly Market Prices and Uncertainty Report, a companion report to EIA's Short-Term Energy Outlook.
Principal contributor: Jeff Barron
Tags: financial markets, futures, liquid fuels, oil/petroleum, prices