
At end of summer driving season, gasoline prices are lower than past two years
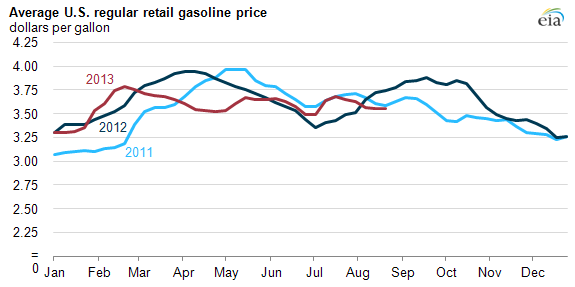
As the Labor Day weekend approaches, the U.S. national average retail price for regular gasoline has fallen 13 cents per gallon below the apparent summer peak of $3.68 per gallon, reached on July 22. Last Monday, August 26, it was $3.55 per gallon, despite an increase in crude oil prices since early July. At $3.55 per gallon, the average U.S. retail price for regular gasoline is 19 cents below last year's price at that time and 3 cents below the level in 2011 leading into the holiday weekend. According to the American Automobile Association, gasoline prices were $3.59 per gallon August 29.
Prices for retail gasoline in the United States currently vary significantly by state and county. Some of the highest gasoline prices in the United States are on the West Coast (see map). However, a key part of the recent decrease in the U.S. average regular gasoline price has been the declining retail gasoline prices on the West Coast. According to EIA data, on August 26, the West Coast average retail price for regular grade gasoline was $3.75 per gallon, 21 cents per gallon lower than the $3.95-per-gallon average on July 22.
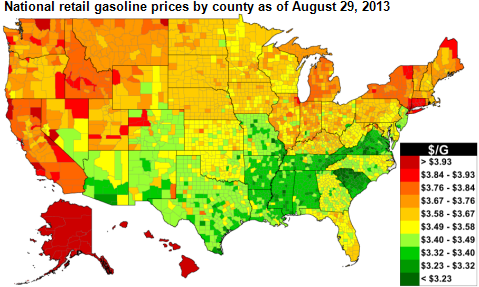
The decline in retail prices on the West Coast resulted largely from a well-supplied California gasoline market. California is the largest gasoline market on the West Coast, accounting for almost two-thirds of gasoline sales in the region in 2012, and price trends in California tend to drive trends in the region as a whole. The average price for regular gasoline in California fell by 23 cents per gallon since July 22 to $3.80 per gallon on August 26.
As of August 23, total U.S. gasoline inventories stood at 217.8 million barrels, 10.0 million barrels (5%) above the five-year average for that week and in the top half of the five-year range. Current U.S. gasoline inventories are much higher than in 2011 and 2012.
Tags: gasoline, inventories/stocks, liquid fuels, map, oil/petroleum, prices