
Electricity demand patterns matter for valuing electricity supply resources
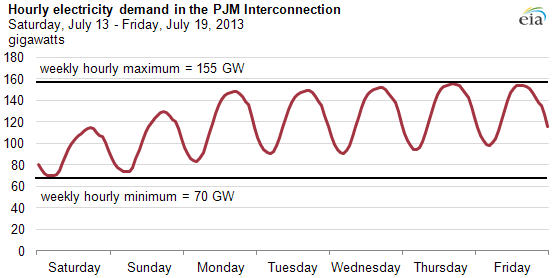
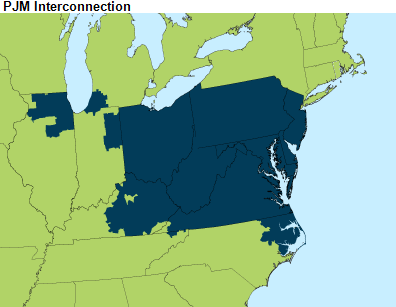
Note: Hourly demand for East Kentucky Power Cooperative, which joined PJM on June 1, 2013, is not included.
Republished August 28, 2013 to correct an link.
The value of existing and potential electricity supply resources depends mostly on how much and when they operate. Because the electric industry currently lacks large-scale storage, supply is adjusted in real time to match demand. Electricity demand varies significantly from moment to moment, hour to hour, day to day, and season to season. Thus, the pattern of electricity demand dictates the type, size, and timing of supply needs.
Demand patterns are not the only factor in assessing supply value or even the most important one. The commercial viability of existing and planned supply depends on their value relative to other sources of supply. Generally, lower variable cost resources are dispatched before higher cost resources to minimize operating costs. But demand patterns are also an essential element to the profitability of supply.
For example, during the week of July 13-19, 2013, PJM Interconnection (PJM), a large electric system stretching from the Mid-Atlantic states to Chicago, had minimum hourly demand of 70 gigawatts (GW) (see chart above). The minimum demand determines the size of the potential baseload service, which are those units running at full capacity all the time, if they are able to operate. Units serving baseload needs include nuclear generators; large, efficient coal-fired generators; natural gas combined-cycle generators (when the price of natural gas is low enough relative to the price of delivered coal); and hydroelectric generators.
Supply sufficient to serve the lowest demand level during the week, which generally occurs on weekend nights, can operate continuously throughout the week. Some small amount of supply will stay on most of the week, but it will shut down on weekend nights. Other supply will cycle off each night, as electricity demand falls from its daily peak, and ramp up again the next day. How much and when such intermediate service units run depends on the pattern of demand. Natural gas-fired units and nonbaseload coal-fired units make up most of intermediate service supply.
Electricity demand also varies significantly over the year (see chart below). PJM's hourly demand topped out at 155 GW on July 18, 2013, at 5:00 p.m. (not including demand from the East Kentucky Power Cooperative area that joined PJM on June 1) and bottomed out at 59 GW on May 27, 2013, at 4:00 a.m. Demand for electricity peaks in the summer and, to lesser extent, in the winter. The spring and fall when demand is lower are often called "shoulder seasons." Many facility operators use these seasons to perform maintenance. Daily and weekly demand variations also grow in summer.
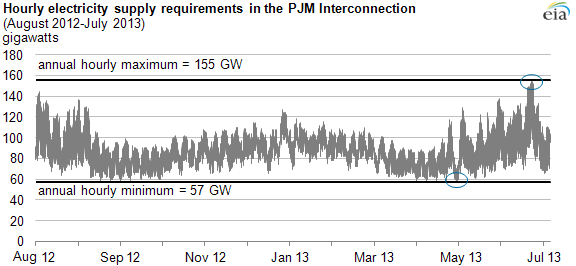
Note: Hourly demand for East Kentucky Power Cooperative, which joined PJM on June 1, 2013, is not included.
In reality, hourly supply requirements do not exactly equal hourly demand because operators need to produce or buy additional supply to account for transmission losses. Moreover, grid operators also build in a capacity reserve, generally 15% of expected annual peak-hour demand, so that they have adequate supplies to respond to high-demand periods and forced (unplanned) outages of generating plants and transmission facilities.
The value of supply varies over time
Rising demand for electricity usually increases operating costs and wholesale prices; conversely, falling demand for electricity tends to lower operating costs and leads to lower wholesale prices because of economic dispatch. PJM's hourly real-time energy prices corresponding to the week of hourly demand values are shown below. Prices also vary by hour and are much more volatile than demand. This means that the time when supply operates is also important to valuing supply because energy revenues depend on output and price.
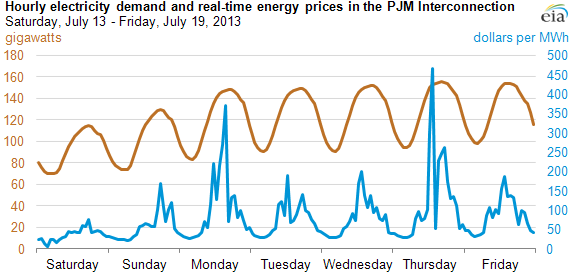
Note: Hourly demand for East Kentucky Power Cooperative, which joined PJM on June 1, 2013, is not included.
During the week shown above, price spikes tended to occur at the end of the morning ramp as the system was bringing on the last units to meet peak demand. In the early hours of Saturday, July 13, real-time prices dropped to near zero. This drop probably was because wind output put pressure on baseload capacity. Baseload operators would rather accept a very low price than decrease the output of their units for a short period of time. The degree to which variable energy resources, such as wind and solar, are a challenge to integrate into electric systems depends on how the pattern of their variable output relates to the pattern of electricity demand.
High real-time prices indicate opportunities for demand response programs and technologies to reduce demand or shift demand to lower-cost hours. Thus, the value of demand response depends directly on the pattern of electricity demand. The extent of variation of demand levels and real time prices also influences the value of electricity storage capacity.
Tags: consumption/demand, electricity, generation, prices