
Energy commodity returns have outpaced nonenergy returns in past month
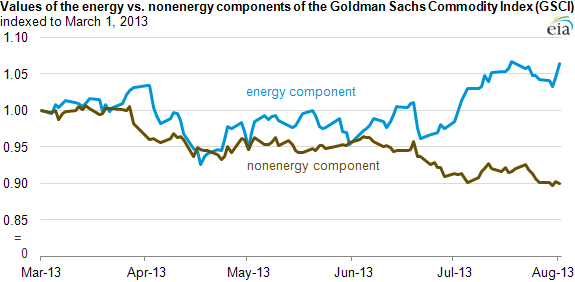
Note: Return values for the energy and nonenergy components of the GSCI are indexed to a starting point of March 1, 2013.
Recent increases in crude oil and petroleum product prices have not been shared by other commodities, as reported in EIA's Market Price Uncertainty Report. Since July 1, the energy component of the Goldman Sachs Commodity Index (GSCI) rose about 8.1% while the nonenergy component of the GSCI decreased slightly (1.5%). This divergence suggests that the recent increases in crude oil and petroleum product prices are most likely not because of changes in expectations for future global economic growth, which would tend to increase all commodity prices. Instead, these increases can likely be attributed to factors specific to petroleum markets, including recent geopolitical developments such as reduced production in Libya.
The New York Mercantile Exchange (Nymex) futures price for the West Texas Intermediate (WTI) crude oil contract accounts for more than one-third of the weighting in the energy component of the GSCI and about 25% of the entire GSCI (both energy and non-energy components). As a result, the rise of WTI over the last month has contributed to the substantial upward movement in the energy index.
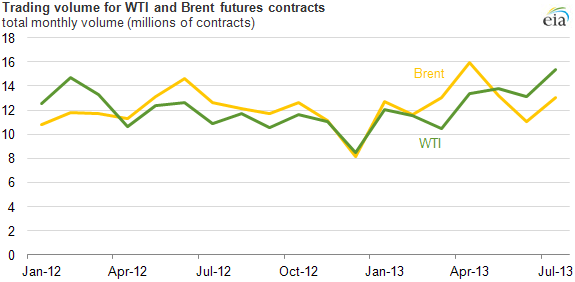
The upward movement in WTI prices has been accompanied by higher trading volumes for crude oil futures contracts on Nymex versus IntercontinentalExchange Brent crude oil futures contracts. Recent developments in the U.S. Midcontinent crude oil market induced more trading in the WTI benchmark compared to Brent. The total monthly trading volume for WTI surpassed Brent trading volumes during May, June, and July. During this period, WTI averaged about 1.5 million more total contracts traded than Brent contracts.
In contrast to energy, other commodities have declined in price this year. Copper, gold, and corn, which together make up about 11% of the S&P GSCI, are down 11%, 22%, and 33%, respectively, since the beginning of the year. The declines can be attributed to factors such as slower-than-expected growth in emerging market countries as well as market-specific explanations such as improved weather that led to higher corn crop yields.
Tags: financial markets, liquid fuels, oil/petroleum, prices