
Rail delivery of U.S. oil and petroleum products continues to increase, but pace slows
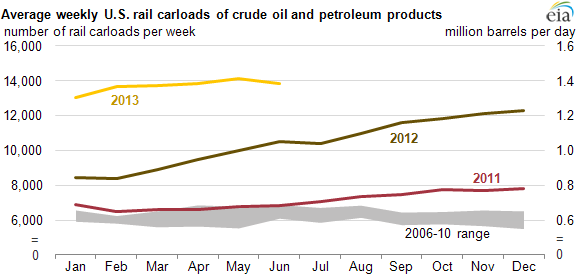
Note: Petroleum product rail shipments do not include ethanol. Conversion of rail carloads per week into million barrels per day includes assumption of 700 barrels per rail carload.
With U.S. crude oil production at the highest level in two decades, outstripping pipeline capacity, the United States is relying more on railroads to move its new crude oil to refineries and storage centers. The amount of crude oil and refined petroleum products transported by rail totaled close to 356,000 carloads during the first half of 2013, up 48% from the same period in 2012, according to Association of American Railroads (AAR).
U.S. weekly carloadings of crude oil and petroleum products averaged nearly 13,700 rail tankers during the January-June 2013 period. With one rail carload holding about 700 barrels, the amount of crude oil and petroleum products shipped by rail was equal to 1.37 million barrels per day during the first half of 2013, up from 927,000 barrels per day during the first six months of last year. AAR data do not differentiate between crude oil and petroleum products, but it is generally believed that most of the volume being moved in the 2006-10 period was petroleum products and most of the increase since then has been crude oil. Crude oil accounts for about half of those 2013 daily volumes, according to AAR.
The roughly 700,000 barrels per day of crude oil, which includes both imported and domestic crude oil, moved by rail compares with the 7.2 million barrels of crude oil the United States produces daily, based on the latest 2013 monthly output numbers from the U.S. Energy Information Administration.
The jump in crude oil production from North Dakota, where there is not enough pipeline capacity to move supplies, accounts for a large share of the increased deliveries of oil by rail. North Dakota is the second largest oil producing state after Texas, as advanced drilling technology has unlocked millions of barrels of tight oil in the Bakken Shale formation.
More Bakken crude oil moving to market by rail has helped narrow the difference between the spot prices for Bakken crude oil and international benchmark Brent crude oil in recent months to its smallest gap—less than $5 per barrel—in more than one-and-half years. The narrower spread reduces the incentive to ship oil to coastal refineries. This development, along with the lack of railcars (some estimates cite a 60,000 car backlog) may explain the slower growth shown in 2013 carload data.
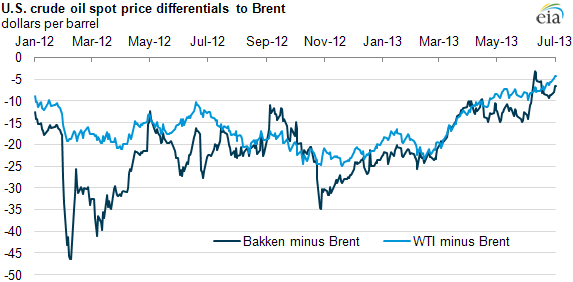
Note: The chart above uses Dated Brent for comparison among the crude oil prices. Dated Brent is a market term for a cargo of North Sea Brent blend crude oil that has been assigned a date when it will be loaded onto a tanker.
Tags: Bakken, Brent, liquid fuels, oil/petroleum, rail