U.S. Energy Information Administration logo
Skip to sub-navigation
July 5, 2013

Food and paper account for 3.4% of nation’s energy use
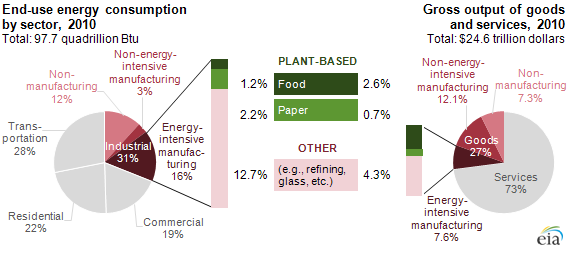
graph of energy consumption and intensity, as explained in the article text
Source: U.S. Energy Information Administration; Department of Commerce, Bureau of Economic Analysis.

The industrial sector, which encompasses manufacturing, mining, agriculture, and construction, is responsible for nearly a third of total energy use in the United States. About half of total industrial energy use is in energy-intensive manufacturing, including food and pulp and paper manufacturers. These industries produce a variety of consumer products, such as the food on grocery store shelves or the paper in your printer, and commodity products, such as flour used by commercial bakers or paperboard used to make cardboard boxes for shipping. These industries accounted for 3.4% of the nation's energy use in 2010, while providing about 3.3% of the nation's gross output of goods and services in the same year.

Food output and energy consumption were relatively flat in recent years. However, both output and energy consumption have declined for the pulp and paper industry over the past decade. The food industry uses less energy, but its diverse activities include a wide range of energy intensities, depending on the product. For example, wet corn milling and sugar manufacturing are an order of magnitude more energy intensive than the dairy industry. Over the long term, EIA projections show a declining contribution from both of these plant-based industries to the economy, but an increasing share of energy consumption (see chart below).
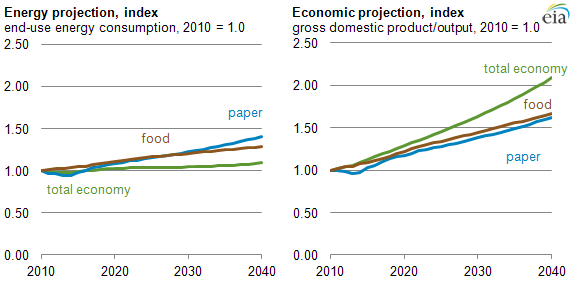
graph of energy and economic projections, as explained in the article text
Source: U.S. Energy Information Administration AEO2013.


The most recent EIA manufacturing sector survey data are available in the Manufacturing Energy Consumption Survey (MECS2010). For more discussion of the industrial sector and individual industries, see EIA's Industry Analysis Briefs and the Annual Energy Outlook 2013 (AEO2013).

Statistics
Analysis
Tools
Education
News

Petroleum & Other Liquids

Crude oil, gasoline, heating oil, diesel, propane, and other liquids including biofuels and natural gas liquids.

Natural Gas

Exploration and reserves, storage, imports and exports, production, prices, sales.

Electricity

Sales, revenue and prices, power plants, fuel use, stocks, generation, trade, demand & emissions.

Coal

Reserves, production, prices, employment and productivity, distribution, stocks, imports and exports.

Nuclear & Uranium

Uranium fuel, nuclear reactors, generation, spent fuel.

Renewable & Alternative Fuels

Includes hydropower, solar, wind, geothermal, biomass and ethanol.

EIA Survey Forms

Forms EIA uses to collect energy data including descriptions, links to survey instructions, and additional information.

Total Energy

Comprehensive data summaries, comparisons, analysis, and projections integrated across all energy sources.

U.S. States

State energy information, including overviews, rankings, data, and analyses.

International

International energy information, including overviews, rankings, data, and analyses.

Environment

Greenhouse gas data, voluntary reporting, electric power plant emissions.

Data Tools, Apps, & Maps

Tools to customize searches, view specific data sets, study detailed documentation, and access time-series data.

Open Data

EIA's free and open data available as API, Excel add-in, bulk files, and widgets

EIA Beta

Come test out some of the products still in development and let us know what you think!

Open Source Code

EIA's open source code, available on GitHub.

RSS Feeds

Subscribe to feeds for updates on EIA products including Today in Energy and What's New.