Electric supply additions are not keeping pace with increased peak-hour demand in Texas
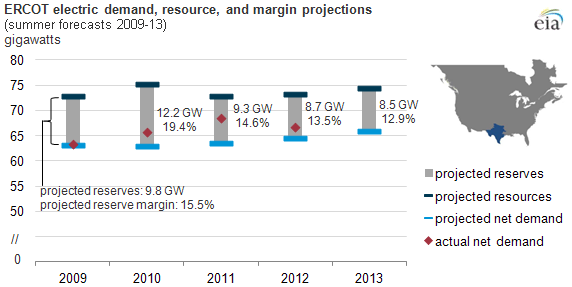
Note: Resources, reserves, and margins are calculated according to the methodology in NERC's 2013 Summer Reliability Assessment (resources as the sum of existing-certain and future-planned capacity, supply-side demand response, and net firm imports); margins for earlier years may not match projections calculated using a previous methodology. A large 2010 margin represents a summer season following more than 4+ GW of capacity additions but preceding almost 2 gigawatts of capacity being retired or mothballed.
A robust economy and population growth have led to increased peak demand for electricity over the past five years in areas of Texas served by the Electric Reliability Council of Texas (ERCOT), the grid operator for most of the state. Regulatory and market uncertainty are some of the factors limiting incentives for significant investment in new supply within ERCOT, leading to a narrowing of reserve margins.
ERCOT is the only region in the North American Electric Reliability Corporation's (NERC) 2013 Summer Reliability Assessment with a reserve margin below target level, which is based on the highest, or peak, hour of demand during the summer. This marks the second year in a row that ERCOT has been below its target reserve margin of 13.75%. With a reserve margin below target, extended periods of high temperatures (similar to the record-breaking summer of 2011) combined with unplanned outages of some generation or transmission capacity may push demand for electric power higher than the available supply, potentially leading to increased calls on emergency demand response programs or even rolling blackouts.
The electric system is expected to have 1,032 more megawatts of capacity available this summer compared with last summer. However, the most recent economic forecasts for the state raised expectations of demand for electricity—particularly in areas of West Texas with increased oil and natural gas drilling—that have outstripped the capacity additions. Some transmission facilities within ERCOT territory have also been upgraded, to help move generation from West Texas wind farms to load centers in the eastern part of the state.
The structure of ERCOT's electricity markets has influenced the incentives available to generators building new capacity. ERCOT is the only regional transmission organization (RTO) that does not have a mechanism for paying for reserve supply. Traditionally, utilities either built or contracted for reserve generating capacity, and the cost was covered through retail electricity rates. This remains the case in most of the country, including CAISO, SPP, and MISO. In PJM, NYISO, and ISO-NE, where there has been divestiture of generation assets by formerly vertically integrated utilities to varying degrees, capacity markets operated by the RTOs provide capacity payments.
In ERCOT, where supply was also divested, generators rely solely on the sale of electricity as a revenue stream. The theory is that tight supply will increase prices and spur investment. Extremely high prices are only reached in times of severe supply constraints and so far have not provided sufficient incentive to add enough capacity to reach NERC's target reserve margins. The Public Utility Commission of Texas has approved an increase in the price cap in ERCOT from $3,000 per megawatthour (MWh) in previous years to $5,000/MWh on June 1, 2013, and ultimately to $9,000/MWh by June 1, 2015, in the hope of encouraging more capacity additions.
One available metric that electric companies use to evaluate where and when to build new capacity is forward prices for electricity. The chart below shows a recent forward curve; summer prices are elevated but the curve is otherwise flat.
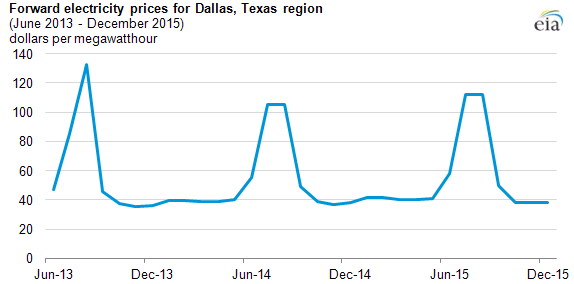
Note: ERCOT North Zone 5MW peak swap futures price as of 6/5/2013.
Tags: capacity, electricity, states, Texas