Industrial sector natural gas use rising
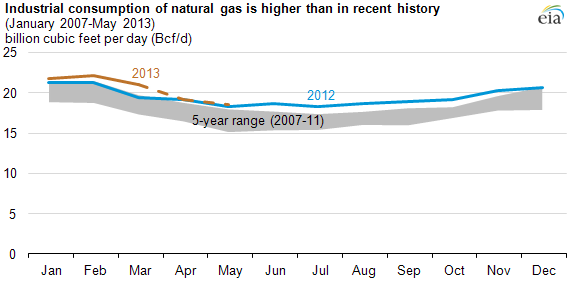
Note: Figures for April and May 2013 are estimates from Bentek Energy LLC based on pipeline flows, represented as a dashed line.
Natural gas use for industrial purposes was more than 3%, or 0.6 billion cubic feet per day, greater during the first five months of 2013 compared to the same period in 2012. Higher industrial gas usage reflects recent economic gains and sustained, historically low natural gas prices that have provided operators of natural gas-intensive industrial facilities in the United States a cost advantage relative to competing facilities that rely on higher-cost energy sources.
Industrial customers form an important gas-use sector, using natural gas for a variety of purposes, including the following:
- Firing boilers for steam needs
- Direct heating for melting, baking, or drying commodities, such as in steel, paper, glass, and food
- Operating a combined heat and power (CHP) facility, which provides both heat and local electricity to run a factory, instead of buying electricity from the grid
In recent years, the electric sector has overtaken the industrial sector as the largest natural-gas consuming sector. However, there has been modest but consistent annual growth in industrial gas use following the sharp economic decline during 2008 and 2009. Unlike the electric sector, whose demand for natural gas is highly price-sensitive, the industrial sector is slower to respond to changes in price. Many industrial plants can increase marginal production relatively quickly, but they often have limited flexibility when choosing fuel energy and feedstock sources. Entirely new petrochemical or manufacturing plants are capital-intensive and take several years to come on line.
The real, inflation-adjusted price of natural gas is currently low by historic standards, and the price of natural gas to industrial consumers is typically close to the spot price because of their large purchasing power and regularity of consumption. If natural gas prices remain low, the industrial sector is poised to grow, and existing industrial natural gas consumers stand to become increasingly competitive both here and abroad.
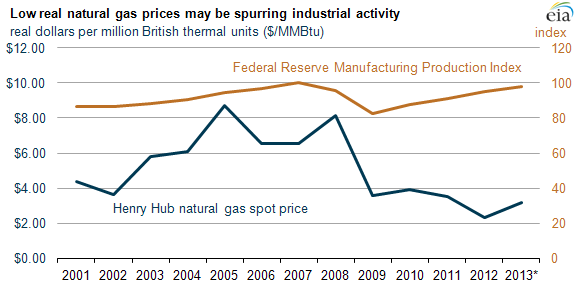
Note: 2013 Henry Hub spot price and Manufacturing Production Index represent partial forecasts from EIA's Short-Term Energy Outlook.
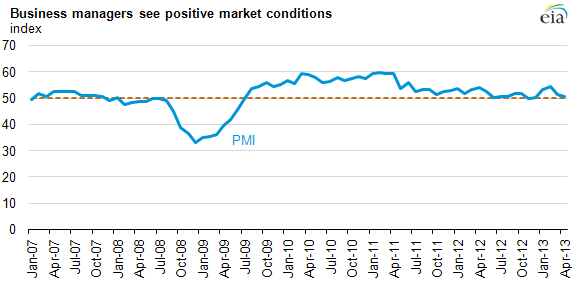
Various manufacturing indicators show an uptick in industrial activity. For example, the Federal Reserve's forecast of the Manufacturing Production Index in 2013 (see above) is expected to near its 2007 peak, underscoring economic recovery since the financial crisis. Another indicator, the Institute for Supply Management's PMI, formerly the Purchasing Manager's Index, highlights whether manufacturers feel that business conditions are improving, staying the same, or worsening each month. An index of 50 means that, on average, business managers believe market conditions are unchanged from the prior month, whereas an index value above 50 indicates improving conditions. Since mid-2009 the PMI has generally exceeded 50.