Menu
Crude oil, gasoline, heating oil, diesel, propane, and other liquids including biofuels and natural gas liquids.
Exploration and reserves, storage, imports and exports, production, prices, sales.
Sales, revenue and prices, power plants, fuel use, stocks, generation, trade, demand & emissions.
Energy use in homes, commercial buildings, manufacturing, and transportation.
Reserves, production, prices, employment and productivity, distribution, stocks, imports and exports.
Includes hydropower, solar, wind, geothermal, biomass and ethanol.
Uranium fuel, nuclear reactors, generation, spent fuel.
Comprehensive data summaries, comparisons, analysis, and projections integrated across all energy sources.
Monthly and yearly energy forecasts, analysis of energy topics, financial analysis, congressional reports.
Financial market analysis and financial data for major energy companies.
Greenhouse gas data, voluntary reporting, electric power plant emissions.
Maps, tools, and resources related to energy disruptions and infrastructure.
State energy information, including overviews, rankings, data, and analyses.
Maps by energy source and topic, includes forecast maps.
International energy information, including overviews, rankings, data, and analyses.
Regional energy information including dashboards, maps, data, and analyses.
Tools to customize searches, view specific data sets, study detailed documentation, and access time-series data.
EIA's free and open data available as API, Excel add-in, bulk files, and widgets
Come test out some of the products still in development and let us know what you think!
EIA's open source code, available on GitHub.
Forms EIA uses to collect energy data including descriptions, links to survey instructions, and additional information.
Sign up for email subscriptions to receive messages about specific EIA products
Subscribe to feeds for updates on EIA products including Today in Energy and What's New.
Short, timely articles with graphics on energy, facts, issues, and trends.
Lesson plans, science fair experiments, field trips, teacher guide, and career corner.
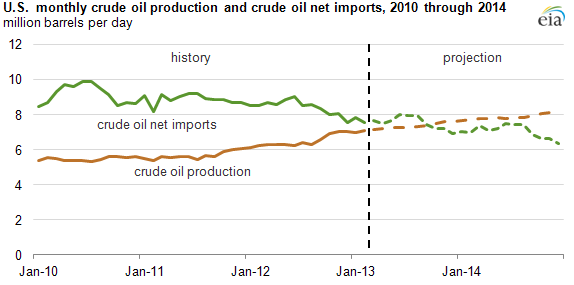
Monthly crude oil production in the United States is expected to exceed the amount of U.S. crude oil imports later this year for the first time since February 1995. The gap between monthly U.S. crude oil production and imports is projected to be almost 2 million barrels per day (bbl/d) by the end of next year—according to EIA's March 2013 Short-Term Energy Outlook.
According to EIA's projections:
This projected change is primarily because of rising domestic crude oil production, particularly from shale and other tight rock formations in North Dakota and Texas.
Given the uncertainties in this forecast, the timing of the crossover between U.S. crude oil production and net crude oil imports could change, based largely on supply conditions. For example, supply would decrease if a strong 2013 hurricane season disrupts U.S. offshore oil production (and thus delays or prevents a crossover), or increase if there are higher-than-expected increases in tight oil production (meaning production might exceed imports sooner than forecast).
Tags: crude oil, exports/imports, gasoline, liquid fuels, North Dakota, oil/petroleum, states, Texas