
Bakken crude oil price differential to WTI narrows over last 14 months
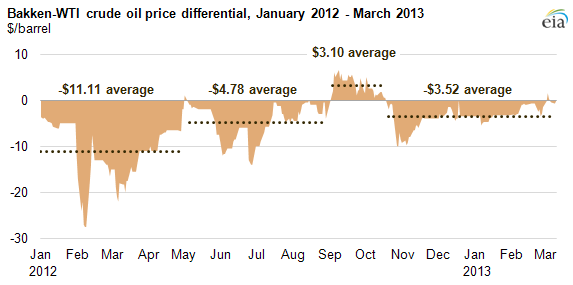
Note: Data through March 12, 2013
Republished March 19, 3:00 p.m. to update data and associated text.
Since the beginning of 2012, the price differential between crude oil produced in the Bakken region of the Williston basin, located mostly in North Dakota, and West Texas Intermediate (WTI) crude oil varied as a result of transportation constraints. Rapidly growing production in the Bakken coupled with lagging takeaway infrastructure (pipelines and rail capacity) contributed to Bakken prices that were as much as $28 per barrel lower than WTI in early 2012.
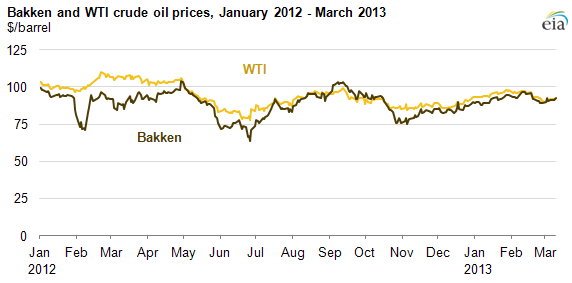
Note: Data through March 12, 2013
Crude oil production in the Bakken grew from 274,000 barrels per day (bbl/d) in January 2011 to 673,000 bbl/d in January 2013, according to the North Dakota Department of Mineral Resources. However, new transportation infrastructure completed in the second half of 2012 helped ease the bottleneck in North Dakota and contributed to a narrowing of the price differential between Bakken and WTI.
Traditionally, the midcontinent pipeline system was configured to deliver crude oil imported to the U.S. Gulf Coast and domestic production from West Texas to the refineries in the Midwest via Cushing, Oklahoma. However, transportation constraints resulting from limited pipeline capacity into and out of Cushing have led to bottlenecks in the region. In February 2012, the discount between Bakken and WTI reached $28 per barrel as increasing Bakken production faced severe transportation constraints. The addition of new rail takeaway capacity from the Bakken region in spring and fall of 2012 let Bakken crude oil bypass the bottleneck in Cushing, Oklahoma and reach refining markets on the East and West coasts, as well as the Gulf Coast. This takeaway expansion resulted in Bakken crude oil briefly selling at a premium to WTI, which unlike waterborne crudes imported by refineries of the East and West coasts is itself subject to transportation constraints at the Cushing, Oklahoma trading hub.
Pipelines are the most cost-effective way to transport crude oil in the United States, but they are expensive to build and may face regulatory hurdles. For these reasons, companies have turned to rail transport to deliver crude oil across the nation. Total takeaway capacity from the Williston Basin grew from about 678,000 bbl/d at the end of 2011 to over 1.1 million bbl/d in 2012. Takeaway capacity via rail represented most of this expansion, increasing from an estimated 265,000 bbl/d in 2011 to approximately 660,000 bbl/d in December 2012.
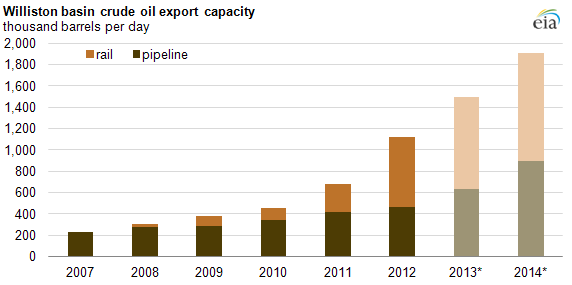
*Note: Data for 2013 and 2014 are projections.
As projects to increase pipeline capacity to more than 650,000 bbl/d and rail capacity to nearly 900,000 bbl/d come online in 2013, takeaway capacity from the Bakken could possibly exceed production growth. With crude oil transportation and production expected to expand in the region, the price differential between WTI and Bakken crude could remain volatile.