
New electric generators typically come online at the start of summer or in December
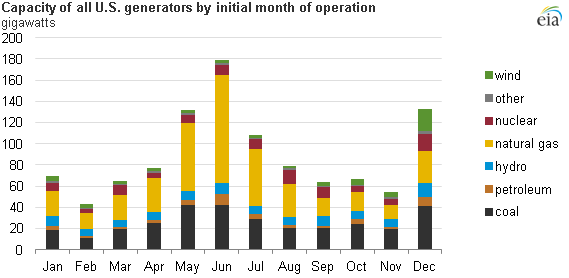
Note: Data for 2012 are preliminary. Data include all operable U.S. generators, the oldest of which first came online in 1891 and the most recent in 2012. Retired generators are excluded. Data show capacity as reported during 2012; a generator's summer capacity is subject to change over time, for example, when the generator undergoes an uprate or derate.
Utilities and other electric power plant developers tend to bring their new generators into commercial operation at certain times of the year. For instance, in December 2012, over 8 GW of new capacity came online. Between May, June, and July of 2013, power plant developers report they expect to bring approximately 5 GW of new capacity online.
Many generators come online in December. This is particularly pronounced for wind generators, because often in recent years, December has been the last month before an expected expiration of the federal wind production tax credit. Other generators may target an online date before the end of a particular year for financial or tax purposes, to fix a certain depreciation schedule, or to meet financing requirements.
Many other generators come online during the summertime, with June as a target month, to be available before the demand for electricity is at its highest level. Often, electric system planners require that a generator be online by June to be considered available to meet the system peak and to be counted in the reserve margin calculation. Finally, wholesale electric power prices tend to be higher in the summertime, so short-term profitability is higher for a generator coming online in June rather than in March.
This trend toward summer online dates is more pronounced for peaking generators, which operate only when electric demand is high, than for baseload generators, which operate more consistently. Taking natural gas-fired generators as an example (see chart below), the trend toward summer online dates is more pronounced for gas combustion turbines and combined-cycle units, which have historically operated as peaking or intermediate generators, than for baseload steam turbines.
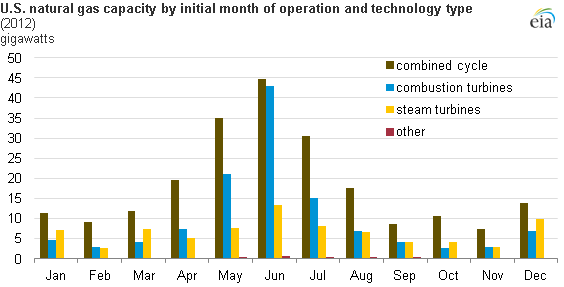
Note: Data for 2012 are preliminary. Data include all operable U.S. generators, the oldest of which first came online in 1891 and the most recent in 2012. Retired generators are excluded. Data show capacity as reported during 2012; a generator's summer capacity is subject to change over time, for example, when the generator undergoes an uprate or derate.
These seasonal patterns hold regardless of the generator's age because generating unit operators have been following this practice for decades.
Tags: capacity, coal, electricity, hydroelectric, natural gas, oil/petroleum, wind