California hydro forecast declines on dry weather
Updated March 5, 2013, to reflect weather developments.
While December 2012 was indeed a particularly wet month, two consecutive dry months in January and February are expected to result in a drier water supply forecast than initially expected for 2013. The next California Department of Water Resources report, expected March 11, will include important data for the northern Sierra Nevada region. This area is crucial to statewide water supplies because it is where snowmelt accumulates to fill the Shasta and Oroville reservoirs. These are the largest reservoirs in California and the primary storage points for state and federal water supply systems.
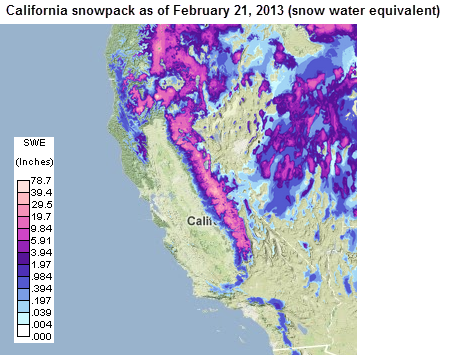
A number of dry years have left California dealing with low water supply, but increased precipitation in December 2012 contributed to near-normal snowpack levels in the Sierra mountains this winter. Snowpack and its snow water equivalent affect California's hydroelectric availability and reliance on sources of various electric generation and imports.
According to the California Department of Water Resources's February 1, 2013 report, snowpack in the northern Sierra Nevada range is 94% of normal, year-to-date from October 1. (Seasonal precipitation accumulation is often described in water years, which run from October 1 to September 30, rather than calendar years). Precipitation in this mountainous region during December was twice the average, a significant departure from the prior year, which was significantly below normal. This latest snowpack measure is somewhat reduced from the prior month's, as January precipitation was significantly below normal.
A previous Today in Energy article on this year's water supply forecast for the Pacific Northwest described the importance of such snowpack and water supply forecasts to the electric power sector, as they provide critical data on the outlook for hydroelectric power in the region. California hydroelectric generators are found along different river basins, and the weather patterns can be significantly different between the two regions, resulting in different water supplies. Therefore, the regions have separate water supply forecasts. California's recent history includes many drought years, bringing additional attention to California precipitation this winter.
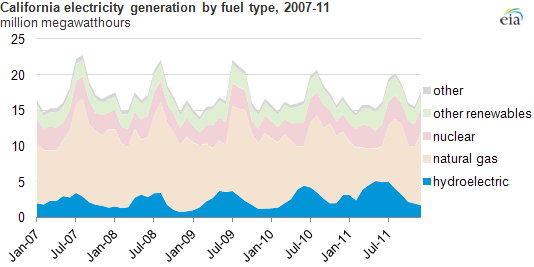
Hydroelectricity in California. Almost 14% of the nation's hydroelectric generating capacity is concentrated in California. Since 1989, hydro has accounted for varying portions of electricity generated within the state of California, from 11% in 1992 (reflecting a low water year) to a high of 28% in 1995 (a high water year). The chart below also shows the seasonal variation in California hydro output over the past several years. Hydro output peaks in the spring and early summer as melting snow flows through the river basins. Overall demand for electricity, however, peaks slightly later, at the height of summer, when air conditioners are running most often.
The chart below shows power generated within California only; to meet total power demand, California also imports power from neighboring regions, including more hydropower from the Pacific Northwest.
Tags: California, electricity, hydroelectric, map, renewables, resources, states