EIA now delivers monthly electricity data in interactive data browser
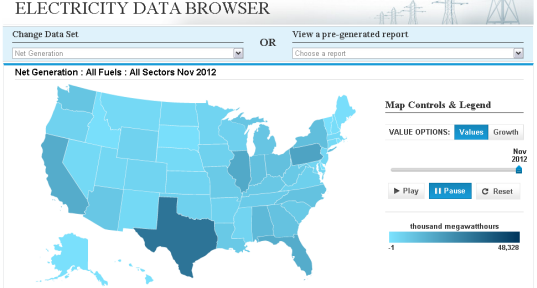
The U.S. Energy Information Administration recently posted an electricity data browser to show generation, consumption, fossil fuel receipts, stockpiles, retail sales, and electricity prices. The data appear on an interactive web page and are updated each month.
The Electricity Data Browser includes all the datasets collected and published in EIA's Electric Power Monthly and allows users to perform dynamic charting of data sets as well as map the data by state. The data browser includes a series of reports that appear in the Electric Power Monthly and allows readers to drill down to plant level statistics, where available. All images and datasets are available for download. Users can also link to the data series in EIA's Application Programming Interface (API). An API makes our data machine-readable and more accessible to users.
Links to analytic reports such as the Electricity Monthly Update, projections such as the Short-Term Energy Outlook and Annual Energy Outlook, and pertinent Today in Energy articles are also available from the page.
The data browser was first made available on EIA's beta website in 2012. After improvements based on user feedback and the addition of more data, the browser was moved to the live site with the publication of November 2012 data.