Hydroelectricity is the most prevalent renewable source in 19 states; wind in 16
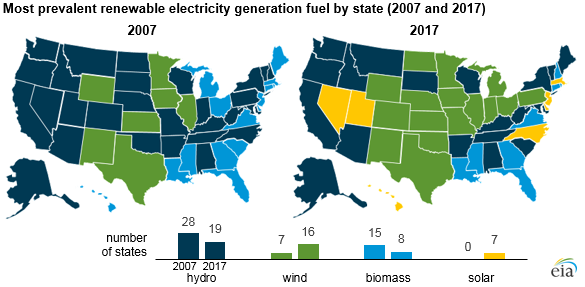
Hydroelectricity represented the largest share of electricity generation among renewable sources in 28 states in 2007 but retained that status in only 19 states in 2017 as wind and solar became more common. Wind was the most prevalent renewable electricity generation source in 16 states in 2017, and solar was the most prevalent renewable generation source in 7 states.
The shares in this article reflect the portions of the total utility-scale electricity and small-scale solar photovoltaic electricity generated in each state. Because the electric system in the Lower 48 states essentially operates as three large interconnections, the electricity generated in one state may be consumed in another.
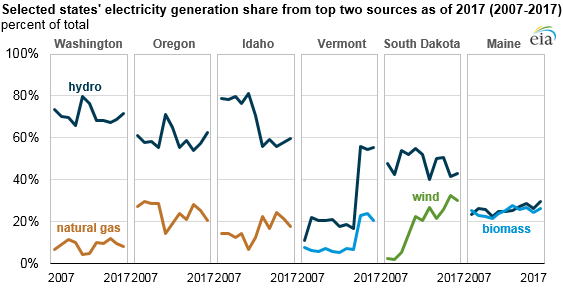
Hydroelectricity was the most prevalent electricity generation source in six states, based on annual data for 2017. In 2017, Washington had the largest hydroelectricity share at 72% of the state’s total electricity generation. Hydroelectricity is the only renewable source to be the most common electricity generation source among all sources in any state.
For the United States as a whole, hydroelectricity was the highest renewable electricity generation source in 2017, providing 7% of the national total. By 2019, wind generation is expected to surpass hydro, based on the latest forecasts in EIA's Short-Term Energy Outlook.
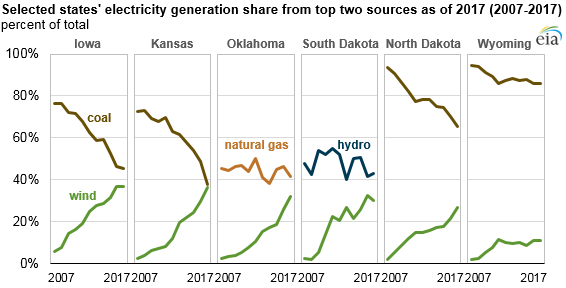
Wind power is currently the second-largest electricity generation source in six states. In particular, wind has increased its generation share at the expense of coal’s generation share in states such as Kansas, Iowa, and North Dakota. As more wind turbines are constructed and come online, Kansas and Iowa may become the first states to have a renewable source other than hydroelectricity provide the largest share of their electricity generation.
In Kansas, 36% of the state’s electricity generation in 2017 came from wind, just behind coal at 38%. So far in 2018, based on monthly data through June, Kansas has generated 42% from wind and 35% from coal. Similarly, 37% of Iowa’s electricity generation in 2017 came from wind—the largest share in the nation that year—but coal remained the most common generation source in the state, at 45%. So far in 2018, those shares have been 37% and 41%, respectively.
Electricity generated from biomass—which includes wood, wood waste, landfill gas, and other biogenic material—had the second-largest generation share in three states in 2017: Maine (26%), Vermont (21%), and Rhode Island (4%). In Maine and Vermont, the share of electricity generated by biomass trails only hydroelectricity, making them two of only three states where renewable fuels provided both of the top two generation shares. South Dakota, where hydroelectricity and wind were the most prevalent sources, is the third state.
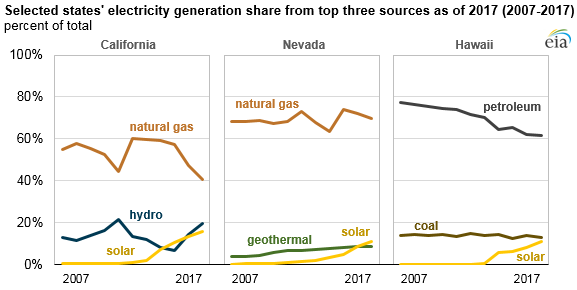
Solar electricity was the second-largest generation source in only one state: Nevada. In 2017, solar accounted for 11% of the state’s generation, behind natural gas at 69%. Solar generation’s share is highest in California, where it provided 16% of the state’s 2017 total, behind natural gas (41%) and hydroelectricity (20%). Solar briefly surpassed hydroelectricity as California’s most common renewable electricity generation source in 2015, when drought conditions resulted in a particularly low year for hydroelectricity in the state.
More information on electricity generation by state, with annual data through 2017 and monthly data through June 2018, is available in EIA’s Electric Power Monthly.
Principal contributor: Owen Comstock
Tags: generation, electricity, renewables, wind, hydroelectric