Weekly Energy Snapshots provides a weekly recap of EIA data visualizations
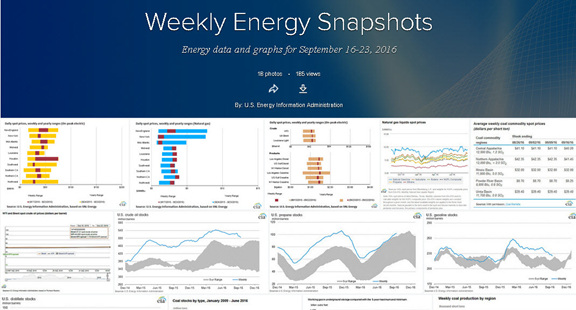
Weekly Energy Snapshots, an album recently launched on the U.S. Energy Information Administration's (EIA) Flickr page, features EIA graphs showing prices, production, inventories, trade, and other key energy data. The album, updated each Friday before noon, highlights data and statistics from the week in charts, graphs, maps, and other images.
Prices. The album features data visualizations that illustrate pricing dynamics in the electricity, natural gas, coal, and petroleum markets. Several charts show weekly and yearly ranges for spot U.S. electricity prices by region, spot U.S. natural gas prices by region, and spot crude oil prices in the West Texas Intermediate and Brent markets. Other graphs show monthly prices for hydrocarbon gas liquids at Mont Belvieu, Texas (a major trading hub), and weekly spot U.S. coal prices by region.
Inventories. The album includes graphs and visualizations that show current levels of U.S. energy inventories of crude oil, gasoline, propane, distillate, and coal. The amount of working natural gas in underground storage and the five-year storage averages are also represented.
Production. Graphs and visualizations included in the album also provide information on weekly coal production in the United States, differences in coal production by week and year, and more detailed information about coal production by region. Other production images provide insight into weekly U.S. natural gas production and weekly outages at nuclear electric generating units.
Weather and contemporary energy trends. The album also includes 6–10 day temperature forecasts across the United States provided by the National Oceanic and Atmospheric Administration (NOAA). The album may include feature maps, graphs, or charts originally published in other EIA publications such as Today in Energy during the covered week.
EIA's Flickr page—launched in May 2014—provides users easy access to most EIA graphs, charts, and other data visualizations. The images are organized by state and by fuel source and collectively have been viewed or downloaded more than 840,000 times.
Principal contributors: John Krohn, Dale Sweetnam, Chris Peterson