Rail continues to dominate coal shipments to the power sector
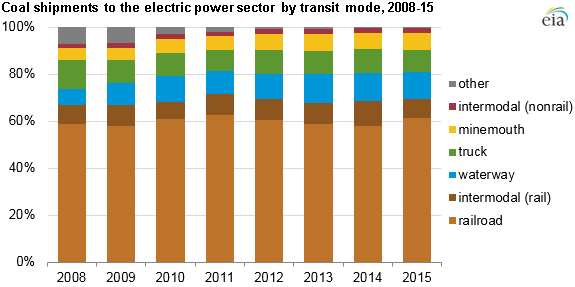
Note: Other includes pipeline, other waterway, Great Lakes barge, tidewater pier, and coastal ports. Intermodal transit uses multiple modes of delivery. Data for 2015 are preliminary.
U.S. electric power generators consumed 740 million tons of coal in 2015, fueling about one-third of total electric power generation and accounting for 92% of all coal consumed in the United States. Nearly 70% of all coal used by power plants to generate electricity was shipped either completely or in part by rail. The rest was transported by waterway, truck, or—for power plants located near a coal mine—by conveyor.
The distribution of coal transit modes varies from year to year. Factors that can affect both the amount and type of coal used by power plants include the adjustment of coal requirements by plant operators, the installation of flue gas desulfurization units that widens the range of coals a plant is able to burn, and changes in regional coal prices.
Although coal consumption in the electric power sector decreased 18% from 2008 (when U.S. coal production peaked) to 2014, the share of coal shipments made either exclusively or in part by rail has remained near 70%. Over this same period, the share of coal shipments made by river barge increased from 7% to 12%. This increase in barge traffic coincides with the growth of coal produced in the Illinois Basin, which relies on shipments along the Ohio River and its tributaries for a significant portion of its production. Shipments made by nonriver barge waterways, slurry pipeline, tidewater piers, and coastal ports (labeled as other modes in the graph above) fell from 7% to 1%. Decreases in coal transportation by these modes can be attributed to increases in the transport costs of these methods, as well as the retirement of many generating facilities that received coal by these methods.
The cost of transporting coal can vary greatly along different routes. Factors affecting coal transport costs include route length, availability of transport mode and supply source options, and the competition between coal and other commodities for transport. EIA's updated summary of coal transportation rates through 2014 shows the average real costs per ton of transporting coal from mines to power plants, as well as transport costs from basin to state and state to state for each transport mode, based on data reported by plant owners and operators to EIA on the Power Plant Operations Report.
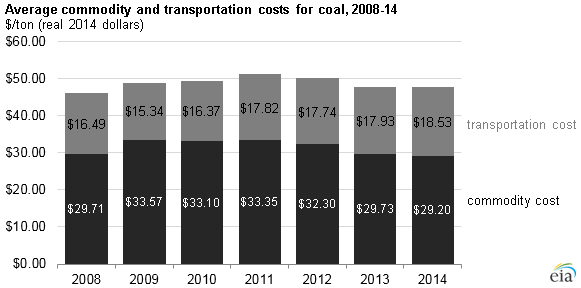
The real delivered cost of coal (commodity cost and transportation cost) remained relatively unchanged from 2013 to 2014 (the latest available data on coal shipment rates), increasing only slightly from $47.66/ton to $47.73/ton. However, the average transportation cost increased in 2014, balancing out a decrease in the commodity cost of coal. The net result showed transportation costs accounting for 39% of the total delivered cost of coal in 2014, the highest percentage since EIA began publishing transportation rate data.
The average cost to transport coal by all modes to electric power plants has increased 12% since 2008. Most of the price increase is a result of increases in the cost to ship coal by rail, which rose 14% over this period. In contrast, the cost of shipping by river barge and truck declined by 18% and 7%, respectively, since 2008.
More information from EIA's coal and electricity industry surveys can be found in the interactive coal data browser and the electricity data browser.
Principal contributor: Elias Johnson
Tags: coal, electricity, generation, rail, transportation