Computer and technology use in education buildings continues to increase
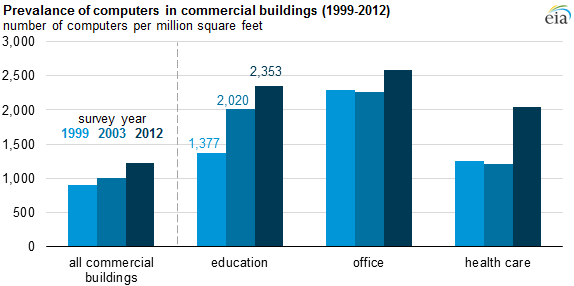
Based on data collected in EIA's latest Commercial Buildings Energy Consumption Survey (CBECS), the number of computers in education buildings across the United States is continuing to grow rapidly. On average, education buildings have nearly twice as many computers per million square feet as all commercial buildings. Among commercial building categories, only office buildings have more computers per square foot.
In education buildings, the number of computers per square foot increased by 71% between 1999 and 2012, more than twice the increase across the commercial sector, and much faster than the growth in the number and size of education buildings. Computers are now used in 95% of education buildings, up from 89% in 2003, when the previous CBECS was conducted. CBECS classifies buildings by the activity that occupies most of their floorspace, so education buildings are those used primarily for classroom instruction. Other buildings commonly found on school campuses such as dormitories, cafeterias, libraries, and athletic facilities are not included in the education category.
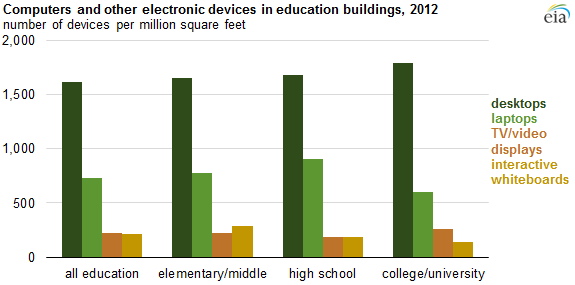
The 2012 CBECS collected information on the number of both desktop and laptop computers, and for the first time included questions about TV/video displays and interactive whiteboards. Of these technologies, desktop computers are the most prevalent across the educational sector (more than 1,600 desktops per million square feet), followed by about half as many laptops on average. College and university buildings have the largest number of TV/video displays per million square feet, while elementary and middle school buildings have the largest number of interactive whiteboards.
These data are likely to understate the impact of technology on education, as the survey for 2012 did not collect information about tablets and smartphones, which are increasingly augmenting and displacing computers. Also, devices brought into buildings for periodic use such as personal laptops owned by college students are not included in CBECS counts. Technology use is rapidly shifting across all building types, and EIA is working to revise the survey questions about computers, other electronics, and many other topical areas for the next iteration of CBECS, which will be conducted for 2017.
Although different usage patterns, combined with different types and ages of the devices, lead to a wide range of energy consumption, a 2014 report prepared for EIA indicates that on average, TV/video displays use much more energy than desktop or laptop computers. This report estimates annual 2015 electricity usage at 1,252 kilowatthours (kWh) for a TV/video display, 469 kWh for a desktop computer (including a monitor), and 24 kWh for a laptop computer. While new computers are generally more energy efficient than older ones, and desktop computers are increasingly being replaced by less-energy-intensive laptops and tablets, the increasing total number of computers and electronic devices means that they will continue to play a large role in building energy use, especially in education buildings.
More CBECS information, including detailed tables about energy-related building characteristics and an upcoming data release schedule, is available from EIA's CBECS website.
Principal contributor: Danni Mayclin