Wholesale power prices decrease across the country in 2015
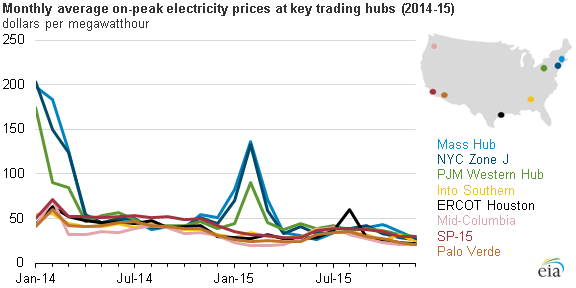
Wholesale electricity prices at major trading hubs on a monthly average basis for on-peak hours were down 27%-37% across the nation in 2015 compared with 2014, driven largely by lower natural gas prices. Because natural gas-fired generation sets the marginal price in many markets, wholesale electricity prices are sensitive to changes in natural gas prices.
Monthly average wholesale electricity prices were typically highest in the Northeast, as was the case in 2014. They were often the lowest at Mid-Columbia in the Pacific Northwest, where hydroelectric dams are a plentiful and low-cost resource, even though water and snowpack levels in 2015 were low compared to historical averages.
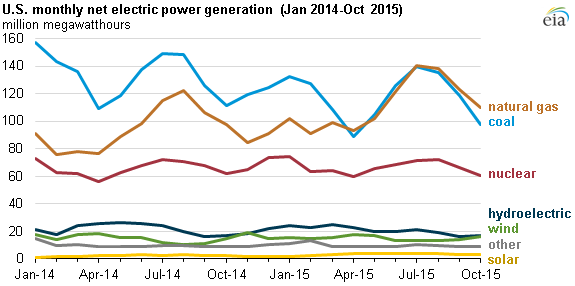
Low natural gas prices in 2015 made natural gas-fired generation more competitive with coal-fired generation than it had been in the past. During April, July, August, September, and October, more electricity was generated from natural gas-fired generators than from coal-fired generators (data for November and December are not yet available). For 2015 as a whole, however, coal is still expected to surpass natural gas as the most prevalent fuel used for electricity generation.
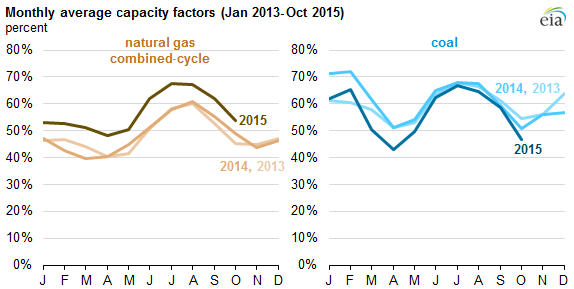
As the average capacity factor for coal-fired generators declined modestly in 2015, the capacity factors for natural gas-fired generators increased, especially for combined-cycle plants. On average, natural gas combined-cycle units across the country operated at capacity factor rates consistently 5%-11% higher each month than either of the past two years. Capacity factors, which measure actual generation as a percent of a potential maximum, averaged 57% for combined-cycle natural gas plants through October, well above the 49% average in each of the two previous January-October periods.
Nuclear generation was the highest since 2010 (through October) as low levels of outages led to high capacity factors. Nuclear outages were less than 3% of capacity this summer and dropped to nearly zero during four days in August, the lowest levels on record.
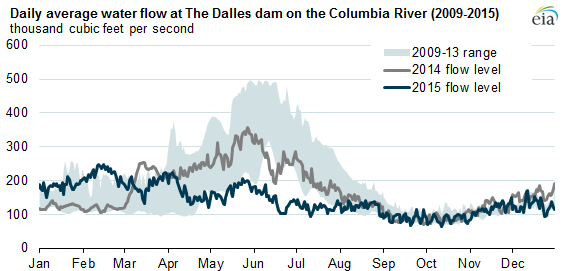
Among renewable sources, hydroelectricity continued to provide the most generation in 2015, accounting for 6% of the nation's total generation through October, despite lower-than-normal water and snowpack levels in several regions with significant hydro resources. For example, water flow at The Dalles, a run-of-river dam on the Columbia River in Oregon, averaged 129,000 cubic feet per second this summer, 36% below last year's summer average and 45% below the average of the summers of 2009-13. Generation from wind and solar plants totaled just 4% and 1%, respectively, through October.
As anticipated at the beginning of 2015, nearly all new utility-scale capacity of 1 megawatt (MW) or greater that was added in 2015 consisted of natural gas, wind, and solar units. Coal units accounted for most generator retirements during the year—more than 11,000 MW of coal-fired capacity retired through October 2015, with an additional 2,600 MW planned to retire by December.
Principal contributor: Tim Shear