Prices for oil and natural gas commodities fell during 2015
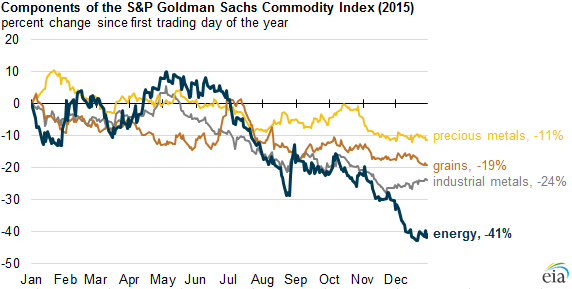
The energy component of the widely followed S&P Goldman Sachs Commodity Index (GSCI) fell 41% from the start of 2015, a larger decline than the industrial metals, grains, and precious metals components, which declined 24%, 19%, and 11%, respectively, in 2015. Weakness in global economic growth contributed to the overall decline in commodity markets in 2015, but unique supply-side factors within certain commodity markets also affected prices.
Each of the 16 commodities in the S&P GSCI Energy, Grains, Industrial Metals, and Precious Metals indices declined in 2015, with prices of some of the energy commodities falling more than 30%. Nickel, diesel, and crude oil had the largest price declines among the 16 commodities in the four S&P GSCI indices, while lead, corn, precious metals, and gasoline had relatively smaller price declines. Each commodity in the S&P GSCI is reweighted each year based on the commodity's world production and trading volume to measure its relative importance in the global economy.
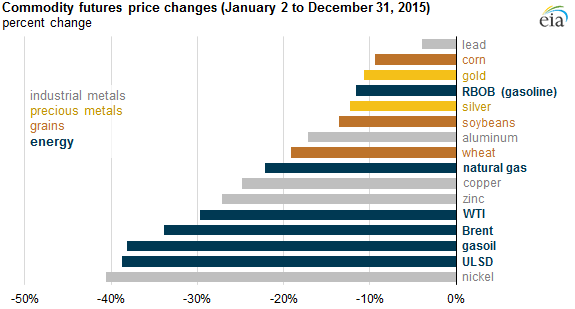
Note: These commodities are included in the S&P GSCI Energy, Grains, Industrial Metals, and Precious Metals indices. All price changes reflect changes in front month futures contract price for each commodity. WTI is West Texas Intermediate, RBOB is reformulated gasoline blendstock for oxygenate blending, and ULSD is ultra-low sulfur diesel.
Energy. West Texas Intermediate (WTI) and Brent, two of the major crude oil benchmarks, account for about 69% of the weighting in the S&P GSCI Energy index. As a result, the energy index tends to follow major price movements in the crude oil market. With sustained, high crude oil production from countries like Saudi Arabia, Iraq, the United States, and Russia, global liquid fuel inventories rose significantly in 2015, resulting in crude oil prices falling to 11-year lows in December.
Petroleum-based products such as reformulated gasoline blendstock for oxygenate blending (RBOB), ultra-low sulfur diesel (ULSD), and gasoil together comprise 27% of the S&P GSCI Energy index. RBOB not only had the lowest price decline of all energy commodities, but it also declined less than many nonenergy commodities because of increased gasoline consumption in the United States and in other countries. In contrast, gasoil and ULSD had the largest price declines of the energy commodities as a result of rising U.S. and global distillate inventories along with lower economic growth in emerging markets.
Natural gas accounts for the remaining 4% of the S&P GSCI Energy index, and in 2015, natural gas futures prices declined to the lowest level in 16 years in mid-December because of increased production and record-high inventory levels.
Grains. The S&P GSCI Grains index includes wheat, corn, and soybeans, with wheat accounting for close to 40% of the index. In late June through July, prices for all three grains rose significantly as adverse weather conditions affected planting and harvesting of grains in parts of the U.S. Midwest. In June, the U.S. Department of Agriculture (USDA) released a quarterly report that showed lower-than-expected corn and soybean inventories as of June 1. However, as harvesting began, updated projections by the USDA for production and inventories of grains were higher than expected, pushing down prices in the second half of 2015.
Metals. Copper and aluminum make up more than three-quarters of the S&P GSCI Industrial Metals index, with zinc, nickel, and lead making up the remainder. The prices of industrial metals were affected by declining activity in China's manufacturing sector along with the economic slowdown of many developed and emerging markets. Nickel had the largest price decline of all the major S&P GSCI commodities because of lower-than-expected demand for stainless steel from countries like China.
The S&P GSCI Precious Metals index is composed of gold and silver, with gold accounting for almost 80% of the index. Growth in the U.S. economy, the strengthening of the U.S. dollar, and the expectations of a rise in the U.S. federal funds rate, which the U.S. Federal Reserve officially voted to increase on December 16, likely contributed to lower precious metal prices.
Principal contributor: Rebecca George
Tags: diesel, gasoline, liquid fuels, natural gas, oil/petroleum, prices