The effect of oil prices on natural gas production
Release Date: 1/15/2020 | Full report
In this analysis, the U.S. Energy Information Administration (EIA) evaluates the effect of oil prices on natural gas production. Depending on the nature of oil and natural gas resources specific to particular regions, changes in future oil prices can produce very different results. Relatively higher oil prices push investment toward oil projects and away from natural gas projects, and relatively lower oil prices typically produce the opposite effect. In regions where oil and natural gas resources do not tend to be comingled, such as Australia, higher oil prices increase oil production without much effect on natural gas production. However, in regions with comingled oil and natural gas resources, such as Brazil, the competition is more complex with less straightforward results. We model production under three oil price cases in Australia and Brazil to illustrate how the combination of resource configurations and price incentives result in different production projections.
Introduction
Oil and natural gas reserves
Oil and natural gas are fossil fuels that are produced from organic matter and are formed through many of the same decomposition, burial, temperature, and pressure processes. Whether oil or natural gas forms depends on the combination of organic material, heat, and pressure. As a result, oil and natural gas are often found close to one another, and in many cases, they are mixed together in underground deposits.
In a typical production scenario, both oil and natural gas are produced from a single well or field, with one considered the primary product and the other, the secondary. In crude oil production, natural gas is often comingled, saturating the oil, and is released when the pressure and temperature change as the oil is brought to the surface. The same happens in reverse with primarily natural gas production; comingled hydrocarbon liquids are separated from the natural gas, typically at natural gas processing plants. Comingled products are handled in various ways.
Oil has typically been the more valuable commodity, and in some cases, the natural gas produced alongside the oil is simply vented or flared. However, global demand for natural gas is growing,[1] and more natural gas infrastructure is coming online to transport natural gas long distances between supply and demand centers.[2] The increased demand for natural gas creates additional options for oil producers. By producing natural gas as a marketable commodity, producers can get more value from their investments.
Despite the deep interconnection between oil and natural gas resources, limited analysis is available on the relationship between oil price changes and natural gas production. Because of the resource connection, changes in the price of oil can affect the production of natural gas through two primary mechanisms:
- Associated gas production. A rise in oil price can prompt increased oil production, which can raise natural gas production by increasing production of associated gas. Conversely, a decline in oil prices can lead to decreased associated gas production.
- Pure gas production. A decline in oil price can also encourage natural gas production by shifting the relative economics and encouraging producers to shift their resources to pure gas projects. In these projects, the primary product is natural gas, and little associated oil is produced. The opposite is also true: a rise in oil price can shift resources to predominantly oil projects.
The configuration of resources in a region can be such that a change in oil price can trigger both mechanisms, and as a result, the relationship between oil price and natural gas production is difficult to predict.
The Global Hydrocarbon Supply Module
For a more thorough analysis of oil and natural gas production, we developed a new component of the World Energy Projection System Plus (WEPS+) for the International Energy Outlook 2019. The Global Hydrocarbon Supply Model (GHySMo) consists of three modules that reflect the economics of hydrocarbon extraction, transformation (refining), and movement. The three modules produce estimates of
- Natural gas
- Crude oil
- Refined product production, processing, and transport[3]
Unlike our other international tools, GHySMo considers the interrelationship between oil and natural gas resources.
The GhySMo upstream module, which is the only component we used in this analysis, represents the volume of global resources and production as a function of resource extraction costs. The module estimates the annual production of oil, natural gas, and associated products in world regions based on externally determined future oil prices. To support the analytic capabilities of this module, we assembled datasets based on multiple independent sources to describe the world’s oil and natural gas resources, as well as the costs, taxes, investment requirements, and drill rig resources associated with their extraction from the earth.
The activities modeled in the GHySMo upstream module include
- Projected expenses to bring products to surface for each of the world’s oil and natural gas fields
- Estimated physical and chemical characteristics for oil and natural gas fields (depth, chemical composition, etc.)
- Expenses for transportation, operation, and maintenance, based on the nations’ discount rates and contemporaneous oil prices
- New discoveries, based on forecast investments as well as past and expected future activity
- Estimated drilling requirements to develop parcels within reservoirs[4]
- Annual production profiles (fractions of total production accomplished each year) based on build out and decline rates for any given development
- Sales income and net present value for each parcel (a parcel is a subunit of an oil or natural gas field within a certain capital cost range)
- Scheduled activation (drilling) of parcels, as well as the associated production years
- Production rates based on price forecasts
- Commodities produced each year
Based on this process, the GHySMo upstream module estimates the future production of both oil and natural gas, and it includes the coproduced products of each. By running the upstream module with different oil prices, which vary the sales income and net present value for all crude oil types, we can estimate the change in crude oil and natural gas volumes. The difference between any two crude oil price paths and the accompanying changes in natural gas production allow us to estimate the impact of oil price changes on natural gas production.
Resource data
For this analysis, we consider oil and natural gas accumulations in three gas-oil-ratio (GOR) categories using physical characteristics of saturated and non-saturated oils, rock properties such as porosity and permeability, and resulting buoyancy:
- Fields with a GOR lower than two are primarily oil with little associated gas
- Fields with a GOR higher than five are mostly natural gas
- Fields with GORs between these two values range from gassy oil at the low end of the scale and wet gas at the upper end
Tight formations can also span the range of GOR, but they have generally higher GOR because they have low permeability and so natural gas can move through the formations more easily than oil. Further, to produce oil, most low-permeability rocks rely on that natural gas movement as a drive mechanism for oil production.
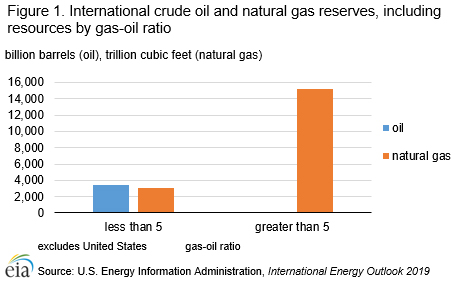
The GHySMo database contains global resource data, excluding the United States.[5,6] Globally, oil is almost exclusively available at GORs lower than five, and natural gas is available both at GORs lower than five and higher than five (Figure 1). With greater resolution, the data show that most oil is available at GORs lower than one (Figure 2). Crude oil resources gradually decrease at a GOR higher than one, and associated gas also increases as the GOR increases. Each extracted unit progressively contains more associated gas. GOR is a continuum where an increase in GOR corresponds to a change from primarily oil wells with associated natural gas production to primarily natural gas wells with associated liquid production.
Different regions have resources at different GORs
This paper presents a sensitivity analysis focusing on two countries: Brazil and Australia. We selected these two countries because their oil and natural gas resources are very different.
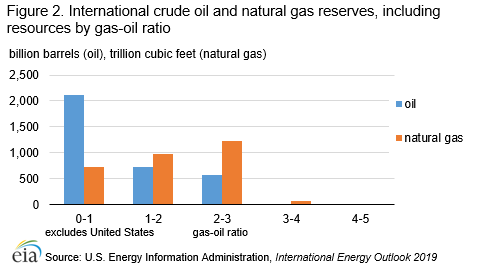
Australia is rich in fossil fuel reserves, and consequently it exports significantly more energy than it imports. Almost all of Australia’s conventional gas resources (about 95%) are located in the North West Shelf (NWS) offshore in the Carnarvon, Browse, and Bonaparte Basins and in the Gippsland Basin in the southeastern region. By contrast, Australian petroleum production is largely onshore and has been declining since its peak in 2000 (Figure 3). Production from new, smaller offshore oil fields generally lasts less than 10 years and does not offset the production declines of larger, mature onshore fields.
Geoscience Australia reported economic reserves, which include proved and probable reserves, of nearly 5.4 billion barrels (22% crude oil, 52% condensates, and 26% liquid petroleum gas) in 2014.[7] For natural gas, the same organization estimated total proved plus probable commercial reserves at 114 Tcf (61% conventional natural gas, 38% coal bed methane, and less than 1% tight gas) as of 2014.[8] GHySMo, as used in this analysis, also includes unconventional and yet-to-be-found resources and reserves, including resources that would be available with a higher price or lower cost.
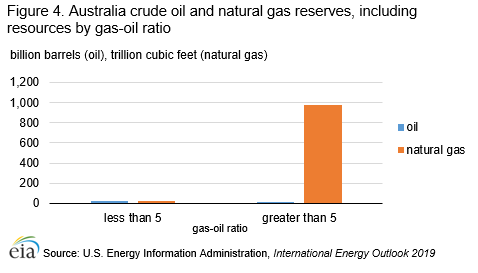
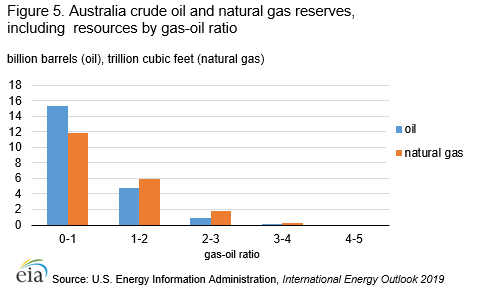
The geographic split between onshore oil production and offshore natural gas production is consistent with resources that are largely pure gas resources and pure oil resources. Each can independently rise and fall without bringing along much associated secondary product. Australian coalbed methane resources are also considered pure gas without associated liquids.
A chart of Australia’s resources by GOR (Figure 4 and Figure 5) demonstrates this characterization of resources. The geographic distinction means that most Australian oil reserves and resources fall into a low GOR category, and the natural gas resources fall into a higher GOR category. Almost all natural gas is at GORs higher than 5, and almost all oil is at GORs lower than 5. As a result, the resources can mostly be extracted independently.
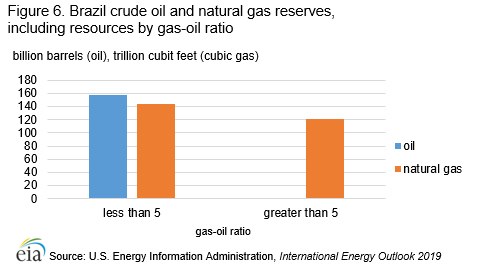
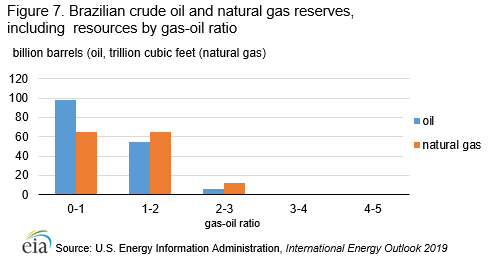
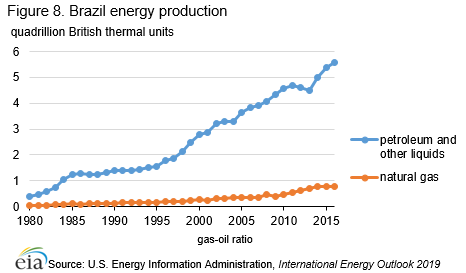
Unlike Australia, Brazil is a growing crude oil and natural gas producing region. EIA estimates that Brazil had 12.8 billion barrels of proved oil reserves in 2019.[9] More than 94% of Brazil’s oil reserves are offshore, and 80% of all reserves are offshore near the state of Rio de Janeiro.[10] EIA estimates that Brazil had 13 Tcf of proved natural gas reserves,[11] most of which (84%) are similarly located offshore, and 73% of offshore reserves are similarly concentrated off the coast of Rio de Janeiro.[12] Relative to Australia, Brazil contains more oil reserves at GORs lower than two (Figure 6 and Figure 7), and these associated natural gas volumes dominate Brazil’s natural gas production. As a result, unlike Australia, Brazil’s natural gas production rises with crude oil production (Figure 8).
Price Case Analysis
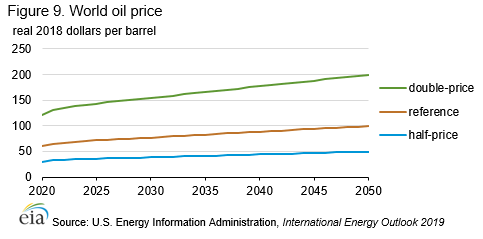
The analysis presents three oil price cases that generate production estimates for Australia and Brazil from 2018 to 2050 (Figure 9):
- Reference: The IEO2019 Reference case oil price path
- Double-Price: Twice the IEO Reference price in all years from 2018 to 2050
- Half-Price: A 50% reduction in the IEO Reference price path from 2018 to 2050
We developed these crude oil price cases in order to explore the basic sensitivities of natural gas production at the regional level. These cases are not intended to serve as predictions of a probable future. Natural gas prices remain constant across cases.
The results of this sensitivity analysis reflect only the effects of changes in price on crude oil and natural gas supply. Absent other factors, within the WEPS+ framework, a price change would generate a demand response that would affect overall energy consumption and other energy supply sources. Although we accounted for these effects within the overall WEPS+ system, we did not include them in this analysis.
Results
Australia
In Australia, the region with a stronger split of oil and natural gas geography, crude oil price changes do not produce a strong effect on natural gas production. Changes in oil price and development have only a minor effect on natural gas production volumes because the region produces few associated resources or those resources have GORs lower than five.
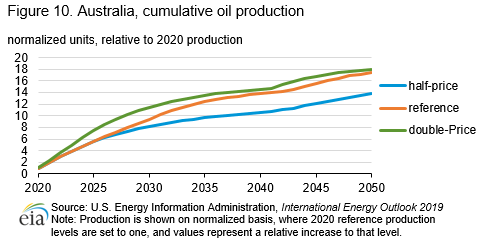
In the Half-Price case, oil production decreases relative to the Reference case (Figure 10). In the Double-Price case, production increases in the near term but is ultimately about the same as the amount of total oil production by 2050 as in the Reference case. Even with doubled prices, Australia runs out of profitable oil at near-Reference case levels of cumulative production. Production is advanced, but few new resources are produced.
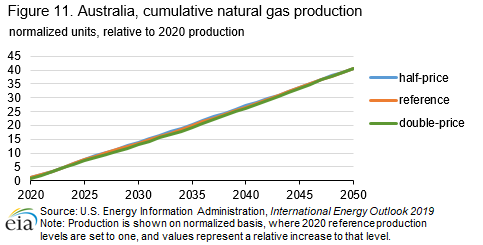
As a result of the resource geography and the few resources containing associated gas with liquid production, natural gas production changes very little in Australia when the oil price changes (Figure 11). Australia’s physically distinct resources result in little coproduction. Regardless of the change to oil price, the resulting change in onshore oil production does not affect the offshore natural gas production. The onshore oil and offshore gas do not compete for the same physical extraction gear. As a result, in Australia, the three price cases are virtually indistinguishable in their natural gas production.
Brazil
As discussed previously, oil price changes across cases can have several consequences at a regional level, depending on the resource types and characteristics involved. In the case of Brazil, higher and lower oil price paths generate multiple impacts.
Unlike Australia, Brazil has large amounts of crude oil resources with associated natural gas, leading to a high level of dependency between total natural gas production and crude oil production. However, Brazil also has large resources of pure gas, and projects targeting that resource are generally independent of crude oil price changes. This collection of hydrocarbon resources allows producers in Brazil to rank and compete crude oil and pure gas development against each other, an opportunity not available to Australia. As a result, the modeled results of varying crude oil price assumptions in Brazil are more complex than those seen in Australia.
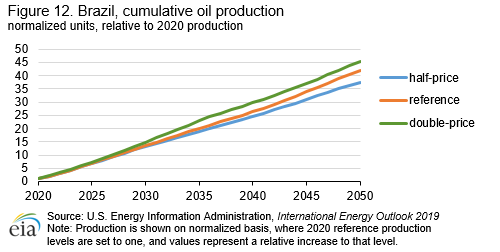
The Double-Price price case projects more oil production than in the Reference case, which in turn projects more production than the Half-Price case price (Figure 12).
Across the three cases, assumed natural gas prices are the same, yet the natural gas production varies (Figure 13) to reflect the competition for rigs in pure gas plays, as well as the role of associated gas.
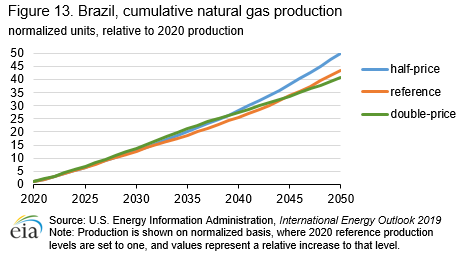
In the Half-Price case, which lowers oil prices, pure gas projects are preferred, and projected natural gas production increases through the entire projection period. Because natural gas prices are unchanged from the Reference case, the lower oil prices increase the relative value of the pure gas projects, and these projects begin development earlier than expected. At the same time, lower crude oil production reduces the development of associated natural gas, offsetting some of the overall natural gas production growth.
In the Double-Price case, the higher oil price leads to a preference for oil projects, with two different consequences during the projection period. All other project economics being equal, the projects with the most associated gas are selected early in the projection period because the natural gas is viewed as a bonus to the oil production. This preference indicates that additional investment is diverted to natural gas processing and shipping to take advantage of the bonus gas. In the near- and mid-term, the increased oil price leads to substantial increases in crude oil production and accompanying increases in natural gas production.
With time, however, this effect diminishes, in part because another effect of doubling oil price is an acceleration of projects, as well as developing what would otherwise have been less economic projects sooner. As a result, cumulative natural gas production is higher at an earlier stage but slows during the mid-to-late projection period. With the higher GOR projects that were selected and developed sooner, fewer projects are available later in the projection period to sustain those higher rates of natural gas production. However, because of the raised oil prices, oil projects continue to take precedence in development capital and infrastructure, and little pure gas development occurs to mitigate the declining volumes of oil projects with associated gas.
Conclusion
Oil and natural gas production is increasingly intertwined. Through these two case studies, we have shown how changes in oil price can produce different results in natural gas production depending on the local resource availability and configuration. For example, associated gas production in oil fields where drilling levels are dictated by oil price can affect drilling levels in areas where drilling is dictated by the natural gas price. Our GHySMo tool helped us estimate these changes in a global context, and shows how Australia and Brazil production is affected differently based on the underlying resources.
Back to topFootnotes
- “EIA projects a nearly 50% increase in world energy usage by 2050, led by growth in Asia,” Today in Energy, September 24, 2019.
- “Australia is on track to become world’s largest LNG exporter,” Today in Energy, August 12, 2019.
- For more information see the Global Hydrocarbon Supply Model Fact Sheet.
- An upstream GHySMo parcel represents that volume of an oil or natural gas that may be produced from a single resource when the unit price is raised from one user-defined cost point (e.g., $30 per barrel) to the next (e.g., $35 per barrel).
- In this paper, we generally refer to accumulations of extractable commodities as “resources and reserves.” While the distinction is not critical to this analysis, further details on these categories is available in “Oil and natural gas resource categories reflect varying degrees of certainty,” Today in Energy, July 17, 2014.
- U.S. resources, which are analyzed in greater depth, are available via EIA’s National Energy Modeling System (NEMS). Documentation of the Oil and Gas Supply Module.
- Geoscience Australia. Australian Energy Resources Assessment.
- Geoscience Australia. Australian Energy Resources Assessment.
- EIA International Energy Statistics Database.
- EIA Country Analysis Brief: Brazil.
- EIA International Energy Statistics Database.
- Resources were first discovered in Brazil’s offshore Santos Basin by state-controlled Petrobras, the dominant participant in Brazil’s oil sector. Further exploration in the Santos, Campos, and Espirito Santo Basins revealed an estimated 5 billion to 8 billion barrels of oil equivalent in a presalt zone 18,000 feet below the ocean surface.