2002 MECS Survey Data 2022 |2018 | 2014 | 2010 | 2006 | 2002 | 1998 | 1994 | Archive
- Data
- Methodology & Forms
2002 MECS Methodology sections / 2002 Survey Forms
2002 Manufacturing Energy Consumption Survey Methodology and Data Quality: Survey Design, Implementation, and Estimates
The Manufacturing Energy Consumption Survey (MECS) is the Federal Government's comprehensive source of information on energy use by U.S. manufacturers. The survey collects data on energy consumption and expenditures, fuel-switching capability, onsite generation of electricity, byproduct energy use, and other energy related topics. Previous MECS surveys were conducted in 1986, 1989, 1992, and 1995, and 1999 (for reporting years 1985, 1988, 1991, 1994, and 1998 respectively). Under the current schedule, the next MECS survey would be conducted for reporting year 2006, with subsequent MECS surveys conducted every 4 years thereafter.
The basic unit of data collection for this survey is the manufacturing establishment. A nationally representative sample of these establishments supplied the information through mailed questionnaires, although a subset of respondents supplied information electronically. The Manufacturing and Construction Division of the Bureau of the Census, in consultation with EIA, selected the MECS sample, conducted fieldwork, and processed the data.
This web product presents a summary of the design and implementation procedures for the survey, highlights differences between reporting periods, and describes the types of estimates included in this report.
Sample Design
The 2002 MECS was conducted using a stratified probability proportionate to size (PPS) sample design. The sampling units in the MECS are manufacturing establishments. The sample frame consists of the manufacturing establishments in the United States that are included in the Economic Census-Manufacturing (EC-M) mail file. The EC-M (formerly known as the Census of Manufacturing, or CM) is the manufacturing portion of the Economic Census, which is conducted every five years by the U.S. Census Bureau. The Census Bureau's Business Register is the universe of establishments for the Economic Census. The EC-M mail file includes all manufacturing establishments of multi-unit companies and all single-unit companies with five or more employees (this number varies slightly across manufacturing industries). Approximately 97 percent of the total payroll in the manufacturing sector is represented in the mail file. The manufacturing sector is defined according to the North American Industry Classification System (NAICS).
The manufacturing sector (NAICS Sector 31-33) consists of all manufacturing establishments in the 50 States and the District of Columbia. The manufacturing sector is defined according to the North American Industry Classification System (NAICS). The manufacturing sector (NAICS Sector 31-33) consists of all manufacturing establishments in the 50 States and the District of Columbia. According to the NAICS manual:
- The manufacturing sector comprises establishments engaged in the mechanical or chemical transformation of materials, substances, or components into new products. The assembling of component parts of manufactured products is considered manufacturing, except in cases where the activity is appropriately classified in Sector 23, Construction;
- Establishments in the manufacturing sector are often described as plants, factories, or mills and characteristically use power driven machines and materials-handling equipment. Manufacturing establishments may process materials or may contract with other establishments to process their materials for them. Both types of establishments are included in manufacturing. 1
In the 2002 MECS, the sampling units were stratified by their NAICS codes and by their Census region. The 1998 survey marked the first time that the MECS stratified by NAICS. Before the 1998 MECS, Standard Industrial Classification codes (SIC) were used exclusively. Stratification in 1998 was done by both NAICS and SIC. There is not a one-to-one correspondence between the two systems. There are industries in the SIC manufacturing section that are not considered part of the manufacturing sector according to NAICS and vice versa. For example, consider NAICS 311, a manufacturing sub-sector representing the food industries. One industry that falls under NAICS 311 is Retail Bakeries. The retail bakery industry is not considered part of the manufacturing sector in the SIC system. This means that for either frame of reference, NAICS or SIC, sampling of out-of-scope establishments would be required to completely address the other system. Unfortunately, stratifying only by NAICS means that there is a break in the MECS time series. The Census Bureau web site contains further information on SIC-NAICS conversion.
Each of the 21 NAICS manufacturing industry sub-sectors is covered in the frame (NAICS 311-339) for the 2002 MECS and will continue to be covered in the future. For each version of the MECS, select industries and sub-industries are included as strata. These special selections are included because the establishments in these industries are either heavy consumers of energy (measured by cost of electricity and fuels), users of a significant amount of feedstock, or were selected for programmatic interest. Examples of these three categories, respectively, are NAICS 331111 (Iron and Steel Mills), 325192 (Cyclic Crudes and Intermediates), and 331521 (Aluminum Die-Casting Foundries). Those industries were included in both the 1998 and the 2002 MECS.
For each industry stratum, four samples are drawn---one from each Census Region. For some industry-by-region strata there are very few establishments. Establishment-level data cannot be disclosed, so in some of these, in some of these strata, results must be withheld. It is possible that there are so few establishments in a stratum that an establishment could determine the energy usage data of another establishment in the same strata by knowing the totals.
| The MECS and Surveys Utilized by the MECS | |||
|---|---|---|---|
| Economic Census-Manufacturing (EC-M) | Annual Survey of Manufacturers (ASM) | Manufacturing Energy Consumption Survey (MECS) | |
| Issuing Agency | Manufacturing and Construction Division--US Census Bureau | Manufacturing and Construction Division--US Census Bureau | Energy Information Administration--US Department of Energy |
| Type of Survey | Census | Sample | Sample |
| Information reported in Survey | Economic statistics for the US manufacturing sector | Economic statistics for the US manufacturing sector | Energy consumption statistics for the US manufacturing sector |
| Frequency of Survey | Every five years (years ending with “2” or “7”) | Annual, except for EC-M years | Every four years since 1994, every three years for the 1985-1994 surveys |
| Population of Interest | All US manufacturing establishments | All US manufacturing establishments | Establishments in the EC-M “Mail File” (see below) |
| Sample Population | Set of establishments part of multi-unit companies and single-unit companies with approximately 5 or more employees (this number varies slightly by industry). | EC-M sample population | EC-M sample population |
| Frame | EC-M Mail File: List of establishments in the Census Bureau's Business Register that are part of the EC-M sample population | EC-M Mail File | EC-M Mail File |
| Manufacturing Establishments Sent Forms | Mail file: Establishments accounting for the top 97 to 98% of total payroll in the sector--this is approximately 60% of the establishments in the sector. | Sample of approximately 15% of manufacturing establishments from the EC-M mail file | Sample of 12,000 to 21,000 establishments, depending on the survey year |
| Coverage | 100% of the manufacturing sector (measures from non-mail file establishments are imputed and factored in to the published statistics) | 100% of the manufacturing sector (measures from non-mail file establishments are imputed and factored in to the published statistics) | Establishments accounting for the top 97 to 98% of total payroll in the sector--this is approximately 60% of the establishments in the sector. |
| How Utilized by the MECS | EC-M mail file is used as the frame for the MECS. Establishment measure of size is derived from economic measures from the most recent EC-M or ASM | Establishment measure of size is derived from economic measures from the most recent EC-M or ASM | |
The population of interest is the group of units for which the published statistics from a survey are to be ideally associated. The sample population is the subset of the population of interest that could potentially be selected for the survey. In the EC-M and ASM, the sample population is different from the population of interest in that very small establishments will not be mailed forms. Instead, imputation is used to account for the small establishments. The survey frame in the case of these three surveys is an actual list of the establishments in the sample population.
Coverage Changes in the MECS from 1985 to 2002
The 1998 and 2002 MECS estimates cover 97-98 percent of the manufacturing sector as measured by total payroll in NAICS. The 2-3 percent of the payroll not covered is known to be represented by a subgroup of relatively small but numerous manufacturing establishments. When taken as a whole, this subgroup accounts for roughly 2-3 percent of a number of different economic measures, including energy consumption. Because of the cost and difficulty of accurately surveying this subgroup, it was excluded from the survey and, thus, from the estimates presented by the MECS.
A major difference between the 1998 MECS and the previous surveys is the classification of industry according to NAICS rather than SIC. Not only did this result in different classifications of establishments within manufacturing, but some establishments that were once in manufacturing according to the SIC system are no longer so according to NAICS. Conversely, some establishments that were once considered outside of manufacturing according to the SIC system are classified within the manufacturing sector according to NAICS. Major examples of the former are establishments engaged in logging and publishing. Major examples of the latter group are bakeries, candy stores where candy is made on the premises, and tire retreading. To allow for comparisons between the 1998 MECS and previous years, data were presented according to the SIC definitions as well as the NAICS. In 2002, data were presented for NAICS exclusively.
Due to an adjusted coverage difference between the 1988 survey design and 1985, 1991 and 1994 designs, the coverage of manufacturing estimates varied slightly from the 1988 survey to the other surveys. Therefore, EIA urges that comparisons of estimates produced from these surveys and analysis of trends be done with caution.
The 1991 and 1994 MECS both had similar levels of coverage as the 1998 survey. In contrast, the 1988 MECS estimates represented the entire manufacturing sector. Small establishments excluded from the other MECS surveys were accounted for by means of a population adjustment factor, applied to each establishment's sampling weight (by stratum) after the sample was drawn.
The 1985 estimates excluded the smallest establishments from coverage. That exclusion tends to make 1985 coverage comparable with the coverage in 1991, 1994, and 1998. Due to Census's updating procedures that were in place during the 1985 survey, the coverage might have been slightly less than the 98 percent of the 1991 and 1994 surveys, but exact levels of coverage are difficult to estimate. Because of the coverage differences, caution must be exercised by data users who wish to compare estimates among the MECS years.
Measure of Size (MOS)
There is a large amount of variation in energy usage among manufacturing establishments. To make sure a representative sample is drawn from those establishments, a measure of size (MOS) is assigned to each establishment in the frame. The MOS for an establishment should be representative of its overall energy consumption relative to the other establishments in the stratum. The MOS is used to determine the probabilities of inclusion into the sample. The probabilities determine the weights used in the estimates for the final consumption measures. Thus, the estimates for the strata consumption measures are dependent on the MOS. Ideally, the data should come from one single source that contains values for every sampling unit in the frame. When this is not possible, the MOS must be imputed using the information available.
Because of the complexity of energy throughput at manufacturing facilities, it is impossible to construct a single comprehensive size measure that will be equally effective for sampling to produce the several different energy measures derived from the MECS. For example, the cost of energy and the quantity used both describe energy consumption quantitatively. Other important descriptions include the type of energy used and its function (i.e. feedstock or fuel). Of these, only cost is available at the establishment level because type, function, and quantity were not of interest for the EC-M, which makes up the entire frame for the MECS. The EC-M gives cost of fuel and cost of electricity at the establishment level.
The cost of fuel and the cost of electricity, along with payroll, were used to set up the MOS. For establishments included in the 2001 Annual Survey of Manufacturers (ASM), the cost of energy was obtained directly from the ASM database. Approximately 25% of the establishments in the MECS frame were also included in the 2001 ASM. Those establishments accounted for approximately 83% of the MOS for the frame. Both the MECS and the ASM use unequal probability selection. Most of the establishments in the MECS sample, which are selected based on cost of energy, are in the ASM, even though establishments are selected based on value of shipments. This is because value of shipments is highly correlated with cost of energy. For the establishments not part of the 2001 ASM, cost of energy was taken from the 1997 EC-M and was adjusted to a 2001 basis. Some establishments in the 1997 EC-M had missing values for cost of energy, which meant that imputation was required using annual payroll and industry specific parameters.
Sample Selection
The establishments included in the 1998 and 2002 MECS were selected using a modified version of the Tillé sampling procedures. The basic idea of Tillé sampling is to start with all of the establishments in the universe for a particular stratum, and discard establishments one-by-one until the desired sample size is left. Before this could be done, each establishment in the stratum universe needed to be assigned a probability of being included in the sample. These probabilities were derived with a probability-proportionate-to-size (PPS) approach. Thus, the inclusion probabilities are proportionate to their respective MOS, which was cost of energy.
Once these probabilities were set, the rejection procedure could be carried out. The procedure is an iterative process. It begins with all of the establishments in the industry-by-region stratum eligible for the sample. At each subsequent stage, a randomly selected establishment is thrown out from consideration. Establishments with very large MOS relative to the other establishments in the stratum have a better of chance of not getting thrown out at a particular stage than those with relatively smaller MOS. If the number of establishments in the universe is N and the desired sample size is n, then (N-n) iterations are required.
The Tillé sampling procedure replaced the Poisson procedure used in 1994 because the former was shown to be more efficient than the latter. It has been shown that for a given sample size, the variance in the estimator with Tillé sampling will be as small or smaller than with Poisson sampling. The reasoning behind this is given below in the section titled Variance of the Estimator For Total Consumption.
Description of the Sample
A total of 15,527 establishments were selected and mailed the 2002 MECS. Eighty-one percent of the establishments that were mailed forms responded. The sample size dropped to 14,799 after 728 establishments were found to be either out of scope or out of business. Of the 14,799 active establishments, the response rate was 76 percent and the coverage rate was 90 percent. This means that 76 percent of the active establishments completed the MECS forms and had submitted a valid response to a key variable, and the combined measure of size of the establishments that completed the forms was 90 percent of the combined measure of size of all of the active establishments. This sample size is smaller than the 18,111 selected for the 1998 MECS. However, many establishments were selected in 1998 because they were considered part of an SIC manufacturing industry but were not considered manufacturers according to NAICS.
In selecting the sample size, the MECS had specific criteria for the estimates in the industry-by-Region strata. Each stratum may be thought of as a cell. The upper limits of the coefficients of variation (CV) for the cells are as follows:
Certainty Cells:
- The CV is to be zero in strata where all eligible establishments are selected ("certainty industries"), resulting in a census of these industries (see the table below). All establishments in an industry with less than 100 establishments in the national frame, a cell with less than 30 establishments, or other energy intensive industry are selected with certainty. Cells not meeting this criteria may contain establishments selected with certainty if, for example, they are heavy users of fuel as feedstock as identified by a previous MECS or EC-M.
Non-Certainty Cells:
For the four digit, five digit, and six digit NAICS code sub-industries (NAICS4-6), it was desired to have specific variance tolerances. The following CV targets were set:
-
NAICS6 & NAICS5--------2%
- NAICS4------------------------4%
- NAICS3---------------------8.3%
The following tables contain certainty industries for the 2002 MECS at the national level (so each of the regional cells will be complete certainties as well) and for specific regional cells.
| Certainty Industries--National | |
|---|---|
| NAICS | Industry |
| 11221 | Wet Corn Milling |
| 31131 | Sugar |
| 3122 | Tobacco |
| 322110 | Pulp Mills |
| 322122 | Newsprint Mills |
| 324199 | Petroleum and Coal Products |
| 325110 | Petrochemicals |
| 325181 | Alkalies and Chlorine |
| 325182 | Carbon Black |
| 325192 | Cyclic Crudes and Intermediates |
| 325193 | Ethyl Alcohol |
| 325222 | Noncellulosic Organic Fibers |
| 325311 | Nitrogenous Fertilizers |
| 325312 | Phosphatic Fertilizers |
| 327211 | Flat Glass |
| 327410 | Lime |
| 331112 | Electrometallurgical Ferroalloy |
| 331312 | Primary Aluminum |
| 336112 | Light Truck and Utility Vehicles |
| Certainty Industries--Regional | ||
|---|---|---|
| NAICS | Industry | Region |
| 321 | Wood Products (balance) | Northeast |
| 325212 | Synthetic Rubber | Northeast |
| 325212 | Synthetic Rubber | West |
| 325992 | Photo Film, et... | West |
| 33152 | Aluminum Die-Casting | Northeast |
The following table gives the preliminary sample sizes for the cells in the sample. No establishments appears in more than one cell. The three-digit and four-digit NAICS code cells that have a higher level cell below it starting with the same three or four digits, respectively, are called balance cells. Balance cells account for the higher level establishments with the same starting digits as the balance cells, but do not have their own cells in the MECS. For example, balance cell 321 below represents all of Wood Product Manufacturing that does not fall into NAICS 321113, 3212, or 3219.
National-level certainty industries are marked with (*) and regional-level certainty industries are marked with (#).
| Sample Size by Census Region and Industry Group | ||||||
|---|---|---|---|---|---|---|
| NAICS Code | Industry Group and Industry | Census Region | ||||
| Northeast | Midwest | South | West | Total | ||
| 311 | Food mfg | 129 | 153 | 146 | 141 | 569 |
| *311221 | Wet corn milling | 2 | 30 | 11 | 8 | 51 |
| *31131 | Sugar mfg | 8 | 19 | 40 | 20 | 87 |
| 311421 | Fruit & veg canning, pickling, drying | 47 | 90 | 15 | 78 | 230 |
| 3121 | Beverage mfg | 60 | 68 | 98 | 105 | 331 |
| *3122 | Tobacco mfg | 15 | 6 | 67 | 3 | 91 |
| 313 | Textile mills | 82 | 37 | 110 | 43 | 272 |
| 314 | Textile product mills | 59 | 60 | 73 | 49 | 241 |
| 315 | Apparel mfg | 92 | 69 | 89 | 96 | 346 |
| 316 | Leather & allied product mfg | 37 | 33 | 39 | 29 | 138 |
| #321 | Wood product mfg (balance) | 24 | 24 | 53 | 24 | 125 |
| 321113 | Sawmills | 119 | 139 | 218 | 123 | 599 |
| 3212 | Veneer, plywood & engineered wood product mfg | 21 | 66 | 107 | 74 | 268 |
| 3219 | Other wood product mfg | 126 | 141 | 180 | 143 | 590 |
| 322 | Paper mfg (balance) | 79 | 101 | 86 | 78 | 344 |
| *322110 | Pulp mills | 3 | 11 | 25 | 8 | 47 |
| 322121 | Paper (except newsprint) mills | 61 | 52 | 37 | 15 | 165 |
| 322122 | Newsprint mills | 5 | 3 | 10 | 9 | 27 |
| 322130 | Paperboard mills | 35 | 41 | 57 | 21 | 154 |
| 323 | Printing and related support activities | 154 | 171 | 177 | 146 | 648 |
| 324 | Petroleum and coal products mfg (balance) | 73 | 63 | 60 | 59 | 255 |
| 324110 | Petroleum refineries | 19 | 22 | 49 | 41 | 131 |
| *324199 | All other petroleum & coal products mfg | 9 | 7 | 24 | 9 | 49 |
| 325 | Chemical mfg (balance) | 71 | 81 | 73 | 64 | 289 |
| *325110 | Petrochemical mfg | 2 | 4 | 34 | 2 | 42 |
| 325120 | Industrial gas mfg | 27 | 47 | 75 | 35 | 184 |
| *325181 | Alkalies & chlorine mfg | 4 | 4 | 16 | 6 | 30 |
| *325182 | Carbon black mfg | 0 | 4 | 18 | 1 | 23 |
| 325188 | All other basic inorganic chemical mfg | 45 | 56 | 64 | 33 | 198 |
| 325192 | Cyclic crude & intermediate mfg | 10 | 12 | 24 | 3 | 49 |
| 325193 | Ethyl alcohol mfg | 2 | 25 | 3 | 5 | 35 |
| *325199 | All other basic organic chemical mfg | 57 | 54 | 82 | 28 | 221 |
| 325211 | Plastics material & resin mfg | 47 | 42 | 75 | 42 | 206 |
| 325212 | Synthetic rubber mfg | 26 | 17 | 24 | 28 | 95 |
| *325222 | Noncellulosic organic fiber mfg | 3 | 2 | 69 | 1 | 75 |
| *325311 | Nitrogenous fertilizer mfg | 7 | 24 | 32 | 19 | 82 |
| 325312 | Phosphatic fertilizer mfg | 2 | 5 | 26 | 10 | 43 |
| 3254 | Pharmaceutical & medical mfg (balance) | 28 | 26 | 30 | 46 | 130 |
| 325411 | Medicinal & botanical mfg | 47 | 49 | 38 | 43 | 177 |
| #325992 | Photographic film, paper, plate, & chemical mfg | 7 | 21 | 23 | 28 | 79 |
| 326 | Plastics & rubber products mfg | 176 | 220 | 193 | 175 | 764 |
| 327 | Nonmetallic mineral product mfg (balance) | 79 | 120 | 137 | 87 | 423 |
| 3272 | Glass & glass product mfg (balance) | 40 | 51 | 50 | 56 | 197 |
| *327211 | Flat glass mfg | 11 | 21 | 22 | 13 | 67 |
| 327213 | Glass container mfg | 14 | 16 | 23 | 11 | 64 |
| 327310 | Cement mfg | 29 | 31 | 39 | 27 | 126 |
| *327410 | Lime mfg | 9 | 28 | 20 | 15 | 72 |
| 327993 | Mineral wool mfg | 17 | 24 | 26 | 13 | 80 |
| 331111 | Iron & steel mills | 38 | 45 | 44 | 19 | 146 |
| *331112 | Electrometallurgical ferroalloy product mfg | 5 | 9 | 3 | 3 | 20 |
| 3312 | Steel product mfg from purchased steel | 50 | 76 | 82 | 38 | 246 |
| 3313 | Alumina/aluminum production/processing (balance) | 23 | 51 | 45 | 33 | 152 |
| *331312 | Primary aluminum product | 3 | 12 | 9 | 14 | 38 |
| 3314 | Nonferrous metal (except aluminum) production/processing | 74 | 56 | 39 | 26 | 195 |
| 3315 | Foundries (balance) | 57 | 103 | 55 | 54 | 269 |
| 331511 | Iron foundries | 47 | 105 | 61 | 31 | 244 |
| #331521 | Aluminum die-casting foundries | 19 | 70 | 29 | 28 | 146 |
| 331524 | Aluminum foundries (except die-casting) | 50 | 82 | 33 | 48 | 213 |
| 332 | Fabricated metal product mfg | 201 | 301 | 250 | 204 | 956 |
| 333 | Machinery mfg | 129 | 206 | 137 | 112 | 584 |
| 334 | Computer & electronic product mfg (balance) | 157 | 118 | 100 | 162 | 537 |
| 334413 | Semiconductor & related device mfg | 41 | 25 | 32 | 94 | 192 |
| 335 | Electrical equipment, appliance, component mfg | 106 | 127 | 131 | 93 | 457 |
| 336 | Transportation equipment mfg (balance) | 74 | 170 | 162 | 71 | 477 |
| *336112 | Light truck and utility vehicle mfg | 6 | 23 | 20 | 7 | 56 |
| 337 | Furniture & related product mfg | 104 | 105 | 145 | 124 | 478 |
| 339 | Misc. mfg | 130 | 126 | 130 | 126 | 512 |
| Total | 3,333 | 4,200 | 4,494 | 3,400 | 15,427 | |
Development of the Data File
The estimates in this report were developed from a data file consisting of both directly reported values and more complex items derived from a combination of directly reported values. Reported values consist of responses to the 2002 MECS questionnaires. Those values were supplemented by estimates of energy consumption for nonfuel purposes and offsite-produced fuel consumption at petroleum refineries from another EIA questionnaire.Additionally, the responses to the questionnaire for each responding establishment were supplemented by the following economic data:
- Value of shipments and receipts;
- Value added by manufacturing;
- Total number of employees;
Those economic data were not collected by the 2002 MECS but were provided by the Census Bureau by linking the 2001 ASM and 1997 E-CM economic data with the MECS energy data at the establishment level. Since the MECS was selected from the 1997 E-CM mail file, nearly 7,000 establishments had economic data imputed. The reported energy values were used to construct several derived values, which, in turn, were used to prepare the estimates appearing in selected tables in this report (see the Survey Estimates section in this appendix). Those derived values are defined as follows:
1. Energy Produced Offsite and Consumed as Fuel. This derived value represents onsite consumption of fuels that were originally produced offsite. That is, fuels arrived at the establishment as the result of a purchase, or were transferred to the establishment from outside sources. As such, this derived value is equivalent to "consumption of purchased" fuels as reported by the Census Bureau for the years 1974 through 1981. The Census Bureau defines "purchased" fuels to include those actually purchased plus those transferred in from other establishments.
2. Energy Produced Offsite and Consumed for Nonfuel Purposes. This derived value also represents energy that was originally produced offsite. This energy was used at the establishment site as raw material inputs and feedstocks.
3. Energy Produced Onsite from Nonenergy Inputs and Consumed Onsite as Fuel. This derived value covers materials such as wood chips, bark, and wood waste and pulping liquor. These fuels are produced primarily in pulp and paper mills as a byproduct of wood used in the pulping process. Wood for pulping is not classified as energy in the MECS, and, therefore, would not have been included as an input. This derived value also covers waste materials, biomass, and hydrogen that was produced from the electrolysis of brine. Energy sources such as petroleum and coal that were consumed as fuel and originated onsite from captive mines or wells (an unusual occurrence) are included here also.
4. Energy Produced Onsite from Nonenergy Inputs and Consumed for Nonfuel Purposes. Most onsite-produced energy that is used for nonfuel purposes is derived from other types of energy. The major exception is hydrogen that is produced from the electrolysis of brine. Energy sources such as petroleum and coal that were consumed as a nonfuel and originated onsite from captive mines or wells are included here also.
5. Energy Produced Onsite from Energy Inputs and Consumed as Fuel. This derived value covers a wide range of fuels consumed onsite that are produced onsite as direct products or byproducts of other types of energy.
6. Energy Produced Onsite from Energy Inputs and Consumed Onsite for Nonfuel Purposes. This derived value includes all petrochemical feedstocks and other raw material inputs that were produced onsite from existing energy or from other onsite-produced energy.
7. Energy Produced Onsite from Energy Inputs and Shipped to Other Establishments. This derived value is continued from the 1991 MECS. Data are now collected for certain industries that produce and sell energy sources to other establishments. Most notably, these industries include Iron and Steel Mills (NAICS 331111) and various industries in Chemicals and Allied Products (NAICS 325). If an establishment converts an energy source into a fuel and then ships it offsite to another establishment, the total Btu quantity among the producing and receiving establishments would be duplicative and thus overstated. By deducting this derived value from the producing establishments, the amount consumed at the receiving establishments is not duplicative.
The first four of the derived values represent an addition to the energy consumed onsite and are described in this publication as First Use (formerly Primary Consumption); that is, either energy was produced offsite or was produced onsite from nonenergy inputs. The fifth derived value described above does not represent an addition because it was produced onsite from energy that is already reported as input. Such energy represents duplicate counting of the input energy content. It is, however, a useful measure of onsite-produced fuel consumption and is not duplicative with respect to an estimate of total fuel consumption. The sixth derived value is duplicative with respect to the consumption of energy for nonfuel purposes, and, therefore, was not used to prepare estimates. It was included only for computational purposes and completeness. The seventh derived value is used to adjust First Use of Energy (formerly Primary Consumption). This adjustment was also included in the detailed tables of Appendix A; hence, there is a disconnect in table calculations between the 1991 MECS and the 1994-2002 MECS. This adjustment must be either excluded from later MECS estimates or included with 1991 estimates in order for the statistics from these two periods to be totally comparable.
Assumptions Underlying Derived Values
Two basic assumptions are necessary to produce the derived values from the data reported on the MECS questionnaire. First, it is assumed that any energy produced onsite is disposed of as it is produced. That is, it is burned as fuel and/or consumed as input or feedstock; any excess is flared, dumped, transferred out, sold, or placed into inventory. For the purpose of computing the derived values, a quantity of an energy source produced onsite and placed into inventory during the previous year is not considered onsite production in the reporting year. A corollary of this assumption is that any energy source that was consumed onsite and originated offsite was acquired only if there was not sufficient onsite production to meet the establishment's needs of the energy source in the current year. Second, it is assumed that the priority use of onsite production is first as a shipment (if applicable), then as input or feedstock, and last as fuel. These assumptions are believed to reflect the energy use patterns at the vast majority of, but not all, establishments. The assumptions do provide a consistent method of determining an establishment's nonduplicative total energy consumption and its reliance on outside providers to supply it.
Estimator for Cell Consumption Totals
The statistic reported for each stratum is an estimator of the total of some measure of energy consumption (e.g. the total natural gas, in billion cubic feet, for the Northeast primary metals industry). Modified Horvitz-Thompson estimators6 are used for estimating totals. For each stratum, the estimates are of the following form:
where:
yi , i = 1 : ns are the values of the consumption measure for the ns establishments in stratum s that were selected for the sample and responded.
 which is the actual total for stratum s
Weights Used in MECS Estimates
Each establishment selected for the MECS is assigned a weight for use in the consumption estimates. The initial weights, wi, are inversely proportional to the corresponding measures of size and are adjusted for nonresponse. The nonresponse adjustment is done separately for the certainty establishments and the non-certainty establishments in each cell.
where:
 where ns is the sample size for stratum s and Ns is the population size for stratum s
Poststratified Weights
Initially, the measure of size for each establishment in the frame was derived from its cost of energy values from the 2001 ASM, the 1997 EC-M, or was imputed. Ideally, the MOS should be calculated from the most recent cost of energy values available. In 2002, the EC-M and the MECS occurred in the same year for the first time. After the results of the EC-M were available, new MOS values could be
where:

Kc is the adjustment factor for cells containing only certainty establishments. The x’s are the 2002 EC-M derived MOS values. It should be noted that the MOS was recalculated for every establishment in the MECS frame. The sets of establishments in the various strata of the MECS frame determined to be in-scope using the results of the 2002 EC-M were not, in general, the same as the corresponding initial sets put together using the 1997 EC-M and 2001 ASM. This happened because of misclassification, establishment transfer within the manufacturing sector, and new establishments “born” to the sector.
Estimator for Number of Establishments in Population Totals
The 2002 MECS provides estimates for the number of establishments consuming a particular type of fuel (e.g. coal) by NAICS code at the national level or for the number of establishments participating in an energy management program. An adjusted Horvitz-Thompson estimator is used for this. For industry group s and fuel group f, the estimate for the number of establishments is:

where:
Ns is the number of establishments in the MECS frame which fall into the certainty/noncertainty portion of industry group s . This control total comes from the 2002 EC-M.
= sum of the poststratified nonresponse-adjusted weights for all responding establishments in the certainty/noncertainty portion of industry group S.
Feedstock and Offsite-Produced Fuel at Petroleum Refineries
The basic function of a petroleum refinery (NAICS 324110) is to manufacture a wide variety of petroleum products from crude oil and other liquid hydrocarbon inputs. Those products can be grouped into three classes of use. The largest portion of refinery output is in the form of fuels that are ultimately consumed strictly for their energy content (e.g., motor gasoline, kerosene, and diesel oil). Many refinery products, however, are consumed not for their energy content but for their chemical properties. This class of energy products is generally known as petrochemical feedstock and includes products such as solvents, paints, and detergents. Finally, a third class of product consists of finished materials that are consumed for specific physical properties, rather than for their energy content or chemical properties. Those finished materials include asphalt, lubricants, and waxes and are referred to as nonenergy products.
The MECS was specifically designed to collect information on the consumption of energy for heat, power, and electricity generation, and as petrochemical feedstock and other raw material inputs. The consumption of energy was reported directly by the establishments in the MECS sample, and the estimates in this report reflect that consumption. For most industries, the end result of energy inputs is manufactured products that are not considered energy products. However, fuels produced from refinery inputs are treated as energy products by their subsequent users9 and are reported not only in other manufacturing industries, but also in EIA surveys of consumption in other end-use sectors (residential households, residential vehicles, and commercial buildings). In that sense, refineries do not "use up" the majority of their inputs. They merely convert them from one form of energy (for example, crude oil) to another more usable form (for example, motor gasoline). Therefore, classifying refinery inputs that go into fuels and certain petrochemical feedstocks as refinery consumption would have resulted in massive double counting of total energy consumption, both within the manufacturing sector and across other energy-consuming sectors in the U.S. economy.
The second and third class of refinery products, petrochemical feedstock and nonenergy products, must be treated differently. The creation of those products by the refinery also requires energy inputs, primarily crude oil. The products are combustible and have a known heat content expressed in British thermal units (Btu). Asphalt, for example, contains 6.636 million Btu per 42-gallon barrel. However, the products are not recognized as energy by their subsequent consumers, and no provision was made for collecting data on their consumption from the MECS respondents. Therefore, the transformation of energy inputs to feedstock and nonenergy products must be counted as refinery consumption, or it will never be accounted for anywhere in EIA's consumption surveys.
One characteristic of petroleum refineries is that, except for losses caused by spills, contamination, etc., the Btu content of the energy inputs exactly equals the Btu content of the outputs, both energy and nonenergy. As energy products will be declared energy inputs by receiving establishments, only the Btu quantity of the nonenergy products will not be duplicative of other establishments' consumption. Therefore, EIA includes the Btu value of the nonenergy products in the petroleum refinery nonfuel and first-use estimates as a surrogate for the portion of the energy inputs that were used to produce them. EIA produces such information for all refinery products from the "Monthly Refinery Report," Form EIA-810. This form collects information on the monthly shipments from the universe of refineries in the United States. Those data were the basis for estimating the input energy requirements for the nonenergy products.
The shipment quantities, adjusted for changes in annual inventories, of the nonenergy products and certain classifications of petrochemical feedstock, as reported on the "Monthly Refinery Report," were converted to Btu and summed to produce a monthly refinery total. Those totals were then summed across refineries and months to produce the total Btu value of refinery shipments of nonenergy products for 2002. That total was used to represent the total Btu value of the inputs used to produce the nonenergy products and was inserted directly into the appropriate tables of this report to represent nonfuel consumption in refineries (see Survey Estimates in this appendix). Because the individual energy inputs corresponding to these shipments were not identified, the Btu value was entered in the "Other" column.
The EIA-810 data are also used to calculate the offsite-produced fuel use at the refinery establishment. Because the EIA-846(B) collects only total fuel use of petroleum products (regardless of their origin), it was necessary to use the EIA-810 data to calculate the offsite-produced fuel ratio for those products. Estimation of the ratio utilized the same assumptions described in the section on Assumptions Underlying Derived Values, except that EIA-810 data were used instead. This ratio is then applied to the MECS estimated value of total fuel. 10 The estimator takes the form:

where Op,MECS is the MECS estimate of the amount of petroleum product p produced offsite and consumed as fuel, Op,EIA-810 is the EIA-810 estimate of the amount of petroleum product p produced offsite and consumed as fuel, Fp, MECS is the MECS estimate of total fuel use of petroleum product p, and Fp,EIA-810 is the EIA-810 estimate of the total fuel use of petroleum product.
Estimates of the contribution to fuel consumption of offsite-produced nonpetroleum products are calculated directly from MECS data, applying the same estimation method employed in other NAICS industries.
Shipments of Energy Sources Produced Onsite
Manufacturers who produce energy sources do so not only for their own consumption but often sell or transfer the products to other establishments. The most notable example in manufacturing is petroleum refineries. Energy consumption for those establishments is estimated by using a special method as has been explained in the immediately preceding section. The principal products of petroleum refineries are energy sources. First Use (formerly primary consumption) in petroleum refineries, by virtue of the special method already described, does not need to account for outgoing energy products because it excludes incoming energy sources used for raw materials. Yet there are other types of manufacturers that produce and sell energy sources as secondary products. If the energy content of the sold energy source materials from the secondary products are counted at the producing establishment, there would be double counting when the energy source is counted at the receiving establishment. First Use consumption, as currently defined, avoids double counting of intra-establishment use of an energy source that results from an onsite transformation from another energy source. In addition, it avoids double counting of inter-establishment use of such transformed energy sources. For the 2002 MECS, the estimates can be found in Table 1.
The example that has the greatest effect on total energy consumption is coal used to make coke. A steel mill processes bituminous coal to make coke for later use in the steel making process. For example, First Use consumption counts the quantity of coal as the original nonfuel input. Any onsite consumption of coke produced from the coal is not included in First Use consumption as it duplicates the coal use. If the steel mill sells and ships some of the coke to another establishment, it will show up as an input of an offsite-produced energy source in the second establishment and will be included in that establishment's consumption data. By subtracting the BTU value of the shipments from the producing establishment, the MECS avoids the double counting of the BTU of the input coal in the first establishment with the consumed coke in the second establishment.
Duplication in Fuel Use of Coal Coke and Blast Furnace Gas in the Iron and Steel Industry
MECS analysts have assumed for purposes of estimation that all energy sources used for fuel are completely consumed in the process. That means that an energy source used as fuel will not be transformed into another substance which can later be used for fuel or nonfuel purposes. The assumption holds well enough in most cases even though there may well be an accumulation of waste substance that was not consumed in the heater or boiler. In the case of a blast furnace used in the iron making process (NAICS 331111), the effect of not completely consuming the blast furnace fuel inputs may be a significant cause of duplication. Literature reviews and consultation have revealed that most of the formation of the blast furnace gas would arise from the input fuel use of coke. There may be other contributing sources to the generation of blast furnace gas but they appear to be minor compared to the coke.
One possible solution to adjusting the MECS data so that the energy flows in NAICS 331111 appear reasonable is to adjust the fuel use of coal coke downward by the heat content of the blast furnace gas consumed in that industry. As implied in the preceding paragraph, this would be an imperfect adjustment because not all the of blast furnace gas would necessarily arise from the incomplete combustion of coal coke. Another complication to doing that is that the MECS has historically published only a combined estimate for coke oven gas and blast furnace gas to avoid data suppression brought about by disclosure analysis. However, the proportion of blast furnace gas in those combined estimates has been approximately two thirds. Therefore, for 2002, an estimate for coal coke fuel use in NAICS 331111 in 2002 may be computed as:
Coke and Breeze Fuel Use for NAICS 331111 as reported in MECS: 526 Trillion Btu (Table 3.2 in 2002 MECS).
Coke and Blast Furnace Gas Combine Estimate in NAICS 331111: 293 Trillion Btu. (Table 3.5 in 2002 MECS)
Adjusted Estimate for Coke and Breeze Fuel Use in NAICS 33111: 526 - 2/3(293) = 331 Trillion Btu.
Concept of Fuel-Switching Capability
EIA continues to employ the concept of fuel switching that was developed prior to the 1985 survey. After extensive consultation with potential data users and data providers for the 1985 survey, EIA developed a tightly specified concept of fuel-switching capability based on the following set of principles:
- Switching data would cover consumption of energy for heat, power, and onsite electricity generation only. Switching of energy consumed as feedstock or raw material inputs would not be considered;
- Switching data would focus on capability (what could be done) rather than actual performance (what was, or is being done) or future possibilities (what might be possible);
- Switching capability would be collected for a closed historical reference period, rather than the present or some future reference period;
- Switching capability would be collected for the 1-year reference period used for MECS consumption data to tie in with the consumption data and avoid seasonal bias;
- The survey would measure short-term response capability: that is, actions that could have taken place within 30 days of a decision to switch;
- Switching capability would reflect the total flexibility provided by an establishment's equipment configuration. Both multiple-fired equipment and redundant or backup equipment could contribute to capability;
- The survey would measure in-place capability; which is capability provided by equipment that was already installed or was available at the establishment for installation during the reference period. Major modifications to the design capabilities of equipment and major capital expenditures were not to be considered in assessing capability;
- Switching capability would be valid only if, following the switch from one type of energy to another, the establishment would have been able to maintain its actual production schedule during the reference period;
- Switching capability provided by an establishment's equipment configuration could be limited or negated by legal or practical constraints, such as binding supply contracts, interruptible service, environmental regulations, or unavailability of supply or delivery systems for a potential alternative;
- Economic considerations were not to be considered a practical constraint in evaluating switching capability. The survey was designed to measure potential response to changes in economics or supply patterns.
The MECS obtained fuel-switching data by asking respondents to determine the amounts of 2002 input energy consumption of six major types of energy that could have been switched to one or more alternatives in accordance with the previously listed principles. The six types of energy were purchased electricity, natural gas, distillate oil, residual oil, coal (excluding coke),11 and LPG. Respondents were directed to provide the quantities of switchable consumption by subtracting the quantities that were not switchable from the quantities that were actually consumed during 2002. Such an approach is clear and saves burden because it starts with a previously reported quantity and allows the respondent to subtract quantities known to be nonswitchable because of any one of the various conditions discussed above. The alternative would be to force the respondent to add up quantities for all energy uses for which all aspects of the concept are satisfied. Once the total switchable quantities had been determined, the remaining task was to determine how much of each switchable quantity could have been replaced by specific alternatives.
How To Measure Discretionary Fuel Use
One of the more interesting summary statistics that can be developed from the estimates of actual consumption, minimum consumption, and maximum consumption is the discretionary-use rate. The discretionary-use rate is a measure, in percent, of the extent to which manufacturers elected to consume discretionary quantities of a given energy source. The discretionary-use rate is calculated as:
where USE is the discretionary-use rate of a given energy source;
ACT is the actual consumption of that energy source;
MIN is the minimum consumption, which would have been achieved if all ascertained switching from that type of energy had occurred, and
MAX is the maximum consumption, which would have been achieved if all ascertained switching into that type of energy had occurred.
Thus, the discretionary-use rate is a measure, in percent, of the depth into the discretionary range of consumption to which manufacturers chose to go, given their fuel-switching capabilities and production levels of 2002.
If manufacturers had chosen to minimize their consumption of a given energy source by using alternative energy sources whenever possible, then ACT = MIN, and the discretionary-use rate would be 0 percent. At the other extreme, if manufacturers had chosen to maximize the consumption of a given energy source by using that energy source whenever possible, then ACT = MAX, and the discretionary-use rate would be 100 percent.
Note that (ACT - MIN) is equivalent to the "switchable" amount of the given energy source that was consumed, that is, the amount of the energy source that was consumed even though it could have been switched to another energy source.
The Heat Content of Energy Sources
Many of the estimates of individual energy sources are presented in physical units (kilowatthours, barrels, and short tons). Summary totals need to be in terms of a common unit of measurement, so tables are also given where Btu is the common unit.
A Btu is the quantity of heat required to raise the temperature of 1 pound of water by 1 degree Fahrenheit. Thus, converting physical units of a given type of energy to Btu is a means of expressing the heat content of that energy source. All Btu quantities are in terms of higher heating value, with no regard for efficiency of use. Because no energy consumption process is 100-percent efficient (although some are considerably more energy efficient than others), Btu figures must be considered as the maximum available heat content. The following table presents the Btu conversion factors of major types of energy.
| Table B3. Conversion of Physical Units to British Thermal Units | |
|---|---|
| Type of Energy | British Thermal Units(thousands) |
| Electricity (1,000 kilowatthours) | 3,412 |
| Residual Fuel Oil (42 gallon barrel) | 6,287 |
| Distillate Fuel Oil (42 gallon barrel) | 5,825 |
| Natural Gas (1,000 cubic feet) | 1,030 |
| Liquefied Petroleum Gas (42 gallon barrel) | 3,613 |
| Coke and Breeze (short ton) | 24,800 |
| Bituminous Coal and Lignite Used as Fuel (short ton) | 22,036 |
| Anthracite Coal and Lignite Used as Fuel (short ton) | 26,280 |
| Coal Used for Coking (short ton) | 27,426 |
| Source: EIA, Annual Energy Review, | |
Introduction
Statistics published from sample surveys are subject to error, i.e. nonzero differences between true values from the population and the sample statistics estimating these true values. These errors can be classified as either sampling (random) or nonsampling (systematic) errors.
Nonsampling error occurs during the data collection and processing phase. Examples of nonsampling errors are unit and item nonresponse, undercoverage, and tabulation mistakes.
Sampling Error
The MECS sample frame consists of manufacturing establishments that will be selected for the sample with probability one and establishments with inclusion probabilities less than one and greater than zero. Energy consumption values for the non-certainty establishments vary, leading to variation in consumption statistics for groups of establishments. One measure of the variation of the estimates is the standard error, which is the square root of an estimate of the variance. There are two basic types of statistics reported in the MECS--consumption totals for the population and establishment counts for the population.
Variance of the Estimator for Total Consumption
The variance of the Horvitz-Thompson estimator is:
yi s the consumption value for establishment i,
for all i and j. Thus we have
so, the true variance of the estimator is smaller with Tillé sampling than with Poisson.
Estimated Variances for Consumption Statistics
Estimated variances for MECS consumption total statistics (presented in Estimator for Cell Consumption Totals above) are computed using the following formula:
where:
n is the sample size for the cell,
The estimated variance is a modified version of the Yates-Grundy-Sen sample variance formula that can be found in texts such as Cochran's Sampling Techniques, 3rd ed., 1977 (page 261). In the sample variance formula above, the modified weights are treated as constants.
Estimated Variances of Population Counts
Estimates of the population counts are given for select energy consumption tables. The establishment counts for a given table are presented for the NAICS groups used in the MECS and are broken down by energy source. The estimator used is presented in Number of Establishments in Population Totals above.
The estimated variance is developed using the upper bound for the variance of a ratio, which is used below in Sampling Error of Ratios.
 ,
,where:
where:
Relative Standard Errors of MECS Estimates
For each table of MECS estimates, a mirror table containing the ratios of the standard errors of the estimates to the actual estimates is given. This measure of sampling error is commonly known as the relative standard error (RSE) or the coefficient of variation (CV). Standard errors, which are the square roots of estimated variances, are on the same scale as their respective measures of consumption. Alternatively, RSE’s give a more “standardized” measure of sampling error. While it would not make sense to compare the standard errors of natural gas consumption totals with coal consumption totals for some industry, the RSE’s could be compared because they are not in terms of any unit of measure. The MECS also presents the RSE’s for estimates as two factors on the table where the estimate of interest is found, which, when multiplied together, provide an estimate for the actual RSE’s. The construction procedure for these factors are as follows:
After fitting the model, Ri and Cj are set.
 The estimate of the grand mean is arbitrarily put into Ri instead of Cj.
It is important to remember when interpreting the results of statistical tests with the approximate RSE’s that they are only approximations. The actual RSE’s are published in mirror tables. By including the row and column RSE factors in the same table as the consumption statistics, the reader is reminded that he or she is looking at statistics from a sample survey--not population parameters.
Sampling Error of Ratios
Ratios of manufacturing fuel consumption to various economic characteristics are presented for the 2002 MECS. The ratios are of the form
where
The RSE’s for the ratio estimates are approximated using the following formula:
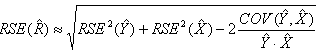 ,
,Nonsampling Error and Bias
Systematic errors are an inevitable part of most surveys, including the MECS, and are prevented and treated as much as is possible. These errors are collectively referred to as nonsampling errors because they are not related to the randomness of the sampling process and thus could occur in a sample survey or a census. Nonsampling errors that affect MECS sample units can be divided into four major categories:
- Operational errors: Quality control procedures are in place for check-in, editing, coding, and keying the returned questionnaires. Data tabulations were independently verified by comparing marginal totals in tables generated from files supplied to EIA with corresponding totals generated directly from microdata files maintained at the Census Bureau.
- Errors of measurement: Survey results for the MECS were subjected to extensive computer editing procedures which were specifically designed to detect errors of measurement. Establishments that were flagged for having reported values severely out of line from what was expected were contacted by MECS analysts. Many major errors, such as reporting values off by orders of magnitude, were corrected.
- Errors associated with the assumptions underlying the derived values: For the measure of size to be perfect, it must be perfectly correlated with the consumption measures. This is generally not the case.
- Errors of Nonobservation: MECS is a legislatively mandated survey and establishments are given sufficient time to respond, but unit and item nonresponse does occur. Adjustments are made to handle this and are explained in the sections above describing the estimators used in the MECS.
Endnotes
1Office of Management and Budget, North American Industry Classification System, 1997 Washington, DC, 1997), p. 105.
2Comparisons among the survey years can be more appropriately made by using internal ratios (e.g., quantity of offsite-produced energy per value of shipments) because the coverage differences that will appear affect both energy consumption and value of shipments equivalently in a given year. See EIA, Manufacturing Energy Consumption Survey: Changes in Energy Intensity in the Manufacturing Sector, 1985-1991, DOE/EIA-0552 (85-91) (Washington , DC, 1995).
3Tillé, Yves (1996), “An Elimination Procedure for Unequal Probability Sampling Without Replacement”, Biometrica, 83, 1, pp. 238-241
4The MECS sample is selected according to establishment characteristics. However, the central administrative offices of multi-establishment companies were the addressees of the questionnaires and were responsible for distributing them to their establishments.
5U.S. Department of Commerce, Bureau of the Census, Annual Survey (Census) of Manufactures, "Fuels and Electric Energy Consumed," 1974-1982 ( Washington , DC ).
6Cochran, William G. (1977), Sampling Techniques, 3rd Edition, pp. 259-261, New York : John Wiley & Sons
7The adjusted weights come from “MECS Poststratification Project-Adjusting Weights using a Census Control Total” by John Slanta and Jeff Dalzell (2004) and a detailed report on the methodology for the 2002 poststratification is found in “Poststratification Methodology for the 2002 Manufacturing Energy Consumption Survey” by Richard Hough and Stacey Cole (2004).
8Certain petroleum products can be classified according to the end user of the product. For example, propane might be a fuel or feedstock, depending on the needs of the receiving establishment.
9Whether a respondent reports petrochemical feedstock as an energy source receipt often depends on the type of feedstock received. If the feedstock received is commonly used as a fuel, such as distillate fuel oil or ethane, then it is assumed that respondents will report it as an energy source receipt. If the refinery product received for petrochemical feedstock use is not normally considered a fuel, the assumption is made that respondents would not report it as an energy source receipt.
10The MECS value for total fuel would also include the amount used at the adjoining petrochemical plant if one were present. Using a ratio based on refinery-only data from the EIA-810 on that portion of the establishment is a source of error. However, refinery fuel use will usually dominate the petrochemical fuel use, especially for petroleum products.
11Coke was excluded because it was found to be virtually nonswitchable in its most common use, the production of steel. Integrated steel mills, for a variety of reasons, have traditionally attempted to minimize the amount of coke required to produce hot metal. Hence, the capability of switching coke is more related to minimizing its use, than to the capacity to switch.
12For a comparison of MECS variance results obtained using Tillé sampling vs. Poisson, see Slanta, John and Kusch, Gary, “A comparison of Modified Tillé Sampling Procedure to Poisson Sampling”, paper submitted to Statistics Canada Symposium 2001.
| EIA-846A (1mb) | This form encompasses the vast majority of the establishments in the Manufacturing Energy Consumption Survey (MECS). These establishments are in industries that are generally less energy intensive. The list of industries that complete the EIA-846A include: Food (311), Beverage and Tobacco Products (312), Textile Mills (313), Textile Product Mills (314), Apparel (315), Leather and Allied Products (316), Printing and Related Support (323), Plastics and Rubber Products (326), Nonmetallic Mineral Products (327), Primary Metals (331, excluding 331111), Fabricated Metal Products (332), Machinery (333), Computer and Electronics Products (334), Electrical Equipment, Appliances, and Components (335), Transportation Equipment (336), Furniture and Related Products (337), and Miscellaneous (339) |
| EIA-846B (1mb) | This is the shortest of the three MECS forms because the Energy Information Administration (EIA) does not want to duplicate data that it has already collected. Only those establishments in the Petroleum Refining Industry (324110) complete the EIA-846B |
| EIA-846C (1mb) | This form is the longest MECS form, and consists of establishments in industries that are usually very energy intensive. The list of industries that complete the EIA-846C include: Wood Products (321), Paper (322), Petroleum and Coal Products (324, excluding 324110), Chemicals (325), and Iron and Steel Mills (331111) |