U.S. Energy Information Administration logo
Skip to sub-navigation
‹ Consumption & Efficiency

Commercial Buildings Energy Consumption Survey (CBECS)

Back to Building Type Reports

vector image of food sales2018 CBECS: Principal Building Activities
Public Assembly

Public assembly buildings are those in which people gather for social or recreational activities, whether in private or non-private meeting halls.
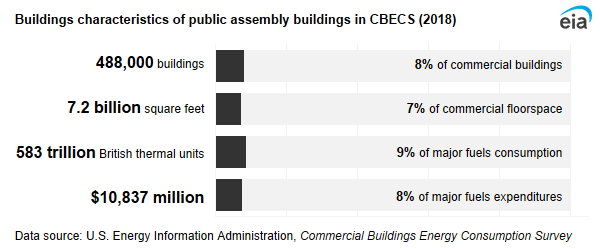


A infographic showing buildings characteristics of public assembly buildings in CBECS. In 2018, public assembly buildings accounted for 8% of commercial buildings, 7% of commercial floorspace, 9% of major fuels consumption, and 8% of major fuels expenditures.

We publish five subcategories of public assembly buildings:

  • Social or meeting
  • Recreation
  • Entertainment or culture
  • Library
  • Other public assembly, which includes armories, exhibition halls, funeral homes, student activities centers, and transportation terminals
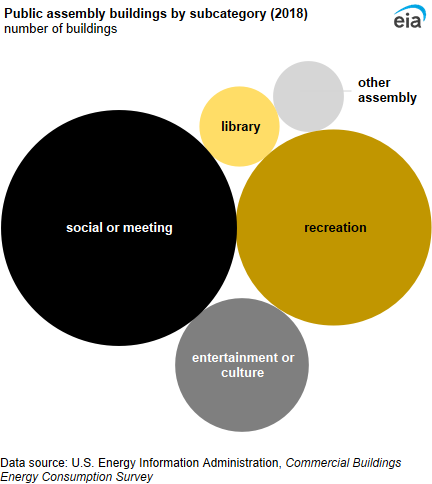
A bubble chart showing public assembly buildings by subcategory. Social or meeting buildings were the most common (45%) public assembly building type.

Social or meeting buildings were the most common (45%) public assembly building type. Recreation (31%) and entertainment or culture buildings (14%) were the second- and third-most common public assembly building types.

About two-thirds (68%) of public assembly buildings were less than 10,000 square feet. Although less than 5% of public assembly buildings were larger than 50,000 square feet, these buildings accounted for more than one-third (36%) of public assembly total floorspace. On average, public assembly buildings were 14,700 square feet per building.
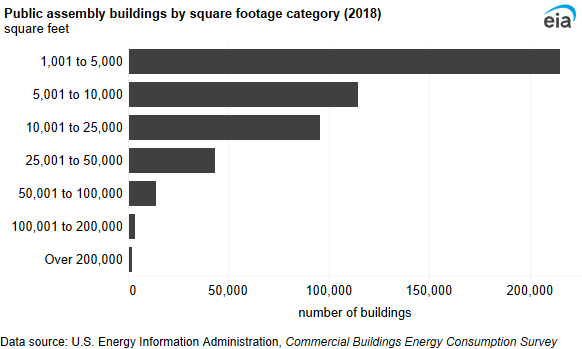
A bar chart showing public assembly buildings by square footage category. About two-thirds (68%) of public assembly buildings were less than 10,000 square feet.

One-third of public assembly buildings were government owned. Of these, most (74%) were owned by local governments.
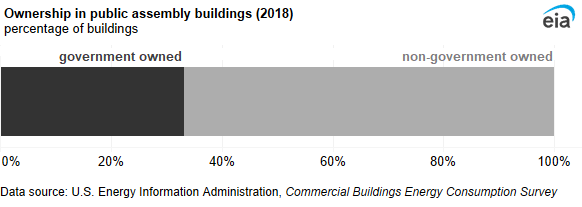
A 100% stacked bar chart showing ownership in public assembly buildings. One-third of public assembly buildings were government owned.

Energy use in public assembly buildings

Public assembly buildings used 583 trillion British thermal units (TBtu) of energy in 2018. Public assembly buildings accounted for 7% of total commercial floorspace and 9% of energy consumption in commercial buildings. Electricity was the most-used fuel (298 TBtu), followed by natural gas (216 TBtu). The mean energy intensity for public assembly buildings was 81.1 thousand British thermal units (MBtu) per square foot. Public assembly buildings had a higher-than-average district heat intensity (66.4 MBtu per square foot); the average district heat intensity for all commercial buildings was 45.2 MBtu per square foot.
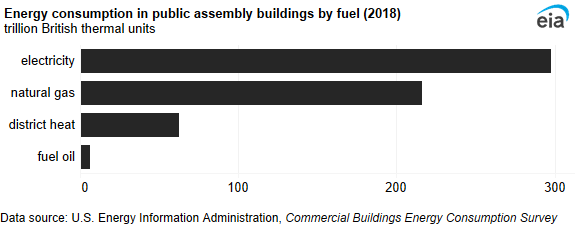
A bar chart showing energy consumption in public assembly buildings by fuel. Electricity was the most-used fuel (298 TBtu), followed by natural gas (216 TBtu).

Recreation (35%), social or meeting (27%), and entertainment or culture (19%) buildings accounted for the majority of energy consumption in public assembly buildings.
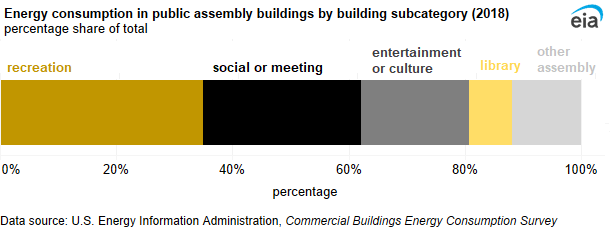
A 100% stacked bar chart showing energy consumption in public assembly buildings by building subcategory. Recreation (35%), social or meeting (27%), and entertainment or culture (19%) buildings accounted for the majority of energy consumption in public assembly buildings.

Space heating accounted for about one-half of end-use consumption in public assembly buildings (48%). Cooling (16%) and other (15%) accounted for the second- and third-largest shares of end-use consumption. All other end uses each accounted for 6% or less of end-use consumption.
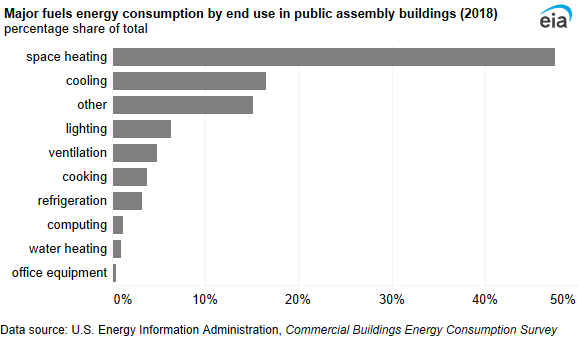
A bar chart showing major fuels energy consumption by end use in public assembly buildings. Space heating accounted for about one-half of end-use consumption in public assembly buildings (48%).

Energy intensity was highest for space heating (41.4 MBtu per square foot) and lowest for office equipment (0.4 MBtu per square foot).
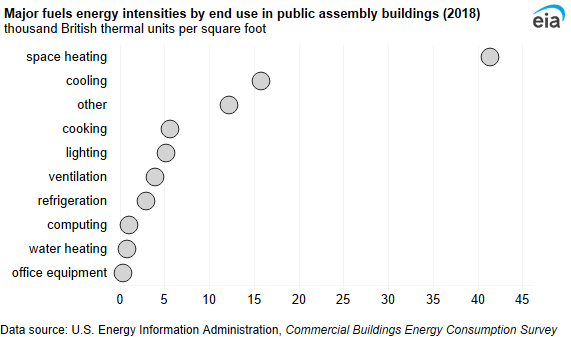
A dot plot showing major fuels energy intensities by end use in public assembly buildings. Energy intensity was highest for space heating (41.4 MBtu per square foot) and lowest for office equipment (0.4 MBtu per square foot).

Inside public assembly buildings

Packaged heating units were the most common heating equipment (36%), followed by furnaces, which were used in 34% of public assembly buildings.
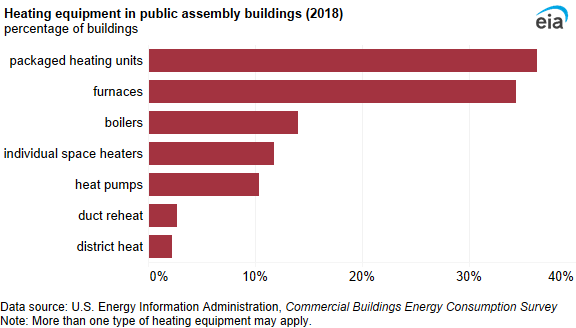
A bar chart showing heating equipment in public assembly buildings. Packaged heating units were the most common heating equipment (36%), followed by furnaces, which were used in 34% of public assembly buildings.

Packaged air conditioners were the most common cooling equipment (46%) in public assembly buildings. The second-most-used cooling equipment was residential-type central air conditioners (26%).
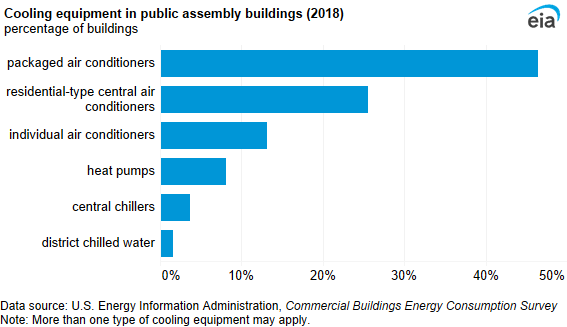
A bar chart showing cooling equipment in public assembly buildings. Packaged air conditioners were the most common cooling equipment (46%) in public assembly buildings.

Statistics
Analysis
Tools
Education
News

Petroleum & Other Liquids

Crude oil, gasoline, heating oil, diesel, propane, and other liquids including biofuels and natural gas liquids.

Natural Gas

Exploration and reserves, storage, imports and exports, production, prices, sales.

Electricity

Sales, revenue and prices, power plants, fuel use, stocks, generation, trade, demand & emissions.

Coal

Reserves, production, prices, employment and productivity, distribution, stocks, imports and exports.

Nuclear & Uranium

Uranium fuel, nuclear reactors, generation, spent fuel.

Renewable & Alternative Fuels

Includes hydropower, solar, wind, geothermal, biomass and ethanol.

EIA Survey Forms

Forms EIA uses to collect energy data including descriptions, links to survey instructions, and additional information.

Total Energy

Comprehensive data summaries, comparisons, analysis, and projections integrated across all energy sources.

U.S. States

State energy information, including overviews, rankings, data, and analyses.

International

International energy information, including overviews, rankings, data, and analyses.

Environment

Greenhouse gas data, voluntary reporting, electric power plant emissions.

Data Tools, Apps, & Maps

Tools to customize searches, view specific data sets, study detailed documentation, and access time-series data.

Open Data

EIA's free and open data available as API, Excel add-in, bulk files, and widgets

EIA Beta

Come test out some of the products still in development and let us know what you think!

Open Source Code

EIA's open source code, available on GitHub.

RSS Feeds

Subscribe to feeds for updates on EIA products including Today in Energy and What's New.