 2018 CBECS: Principal Building Activities
Public Order and Safety
Public order and safety buildings are used for the preservation of law and order or public safety.
We publish three subcategories of public order and safety buildings:
- Fire or police station
- Courthouse or probation office
- Other public order, which includes jails, reformatories, and penitentiaries
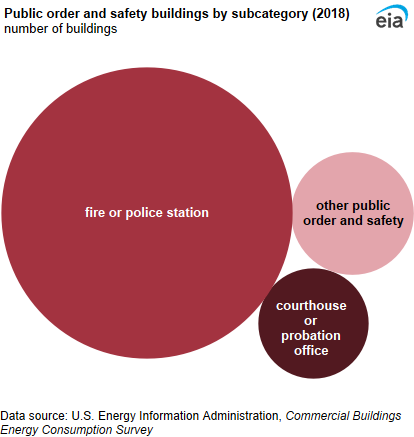
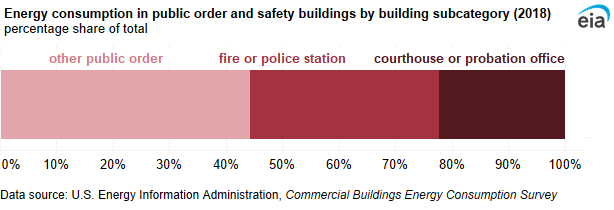
The majority of public order and safety buildings were fire and police stations (76%).
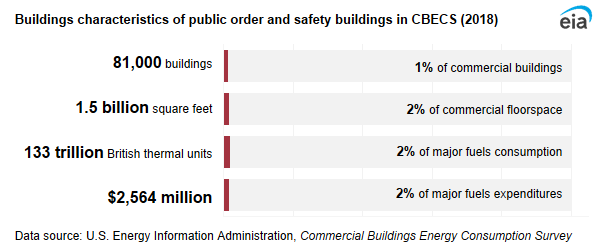
The majority of public order and safety buildings (84%) were less than 25,000 square feet and were government owned (70%). On average, public order and safety buildings were 18,900 square feet per building.
Energy use in public order and safety buildings
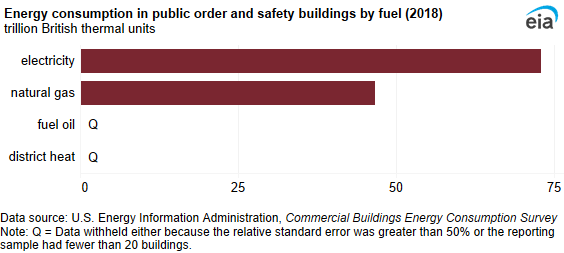
Public order and safety buildings used 133 trillion British thermal units (TBtu) of energy in 2018. Public order and safety buildings accounted for 2% of total commercial floorspace and energy consumption in commercial buildings. Electricity was the most-used fuel (73 TBtu), followed by natural gas (47 TBtu). The mean energy intensity for public order and safety buildings was 86.3 thousand British thermal units (MBtu) per square foot.
Other public order (jails, reformatories, penitentiaries, and other public order buildings) accounted for the largest share of energy consumption (44%).
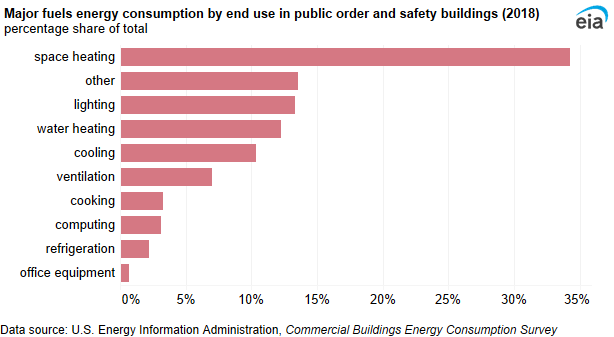
Space heating accounted for the largest share of end-use consumption in public order and safety buildings (34%). All other end uses each accounted for 14% or less of end-use consumption.
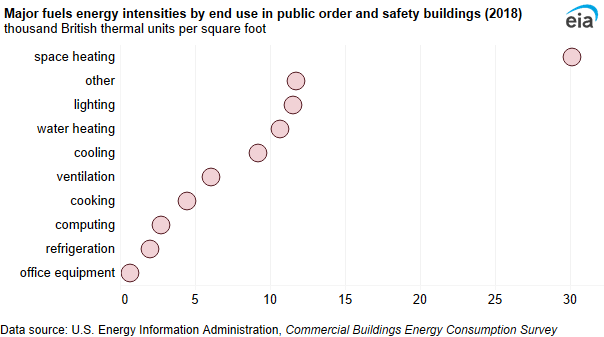
Energy intensity was highest for space heating (30.2 MBtu per square foot) and lowest for office equipment (0.6 MBtu per square foot).
Inside public order and safety buildings
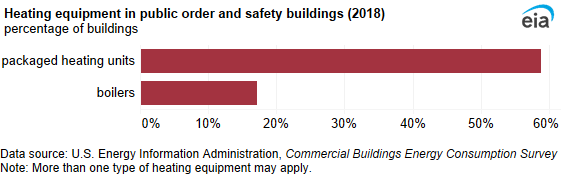
Packaged heating units were the most common heating equipment and were used in 59% of public order and safety buildings. The second-most-used heating equipment was boilers (17%).
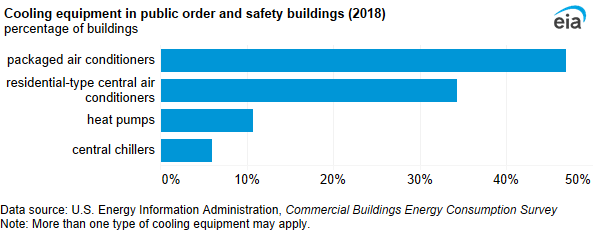
Packaged air conditioners were the most common cooling equipment (47%) in public order and safety buildings. The second-most-used cooling equipment was residential-type central air conditioners (34%).