What is an RSE?
The estimates in the Commercial Buildings Energy Consumption Survey (CBECS) are based on data reported by representatives of a statistically-designed subset of the entire commercial building population in the United States, or a "sample." Consequently, the estimates differ from the true population values. However, the sample design permits us to estimate the sampling error in each value.
It is important to understand: CBECS estimates should not be considered as finite point estimates, but as estimates with some associated error in each direction.
The standard error is a measure of the reliability or precision of the survey statistic. The value for the standard error can be used to construct confidence intervals and to perform hypothesis tests by standard statistical methods. Relative Standard Error (RSE) is defined as the standard error (square root of the variance) of a survey estimate, divided by the survey estimate and multiplied by 100. RSEs for CBECS estimates can be found in the Excel table on the separate RSE tab.
The 95-percent confidence range for a given survey estimate can be determined with the RSE. To calculate the 95-percent confidence range:
- Divide the RSE by 100 and multiply by the survey estimate to determine the standard error.
- Multiply the standard error by 1.96 to determine the confidence error.
- The survey estimate plus or minus the confidence error is the 95-percent confidence range.
For example, from Table B1, the estimate for total floorspace for all commercial buildings in the 2018 CBECS is 96,423 square feet and the estimate's RSE is 3.1 percent. The standard error is (3.1/100)*(96,423 million square feet) or 2,989 million square feet. The 95-percent confidence error is (1.96)*(2,989 million square feet), or 5,859 million square feet. Therefore, with 95 percent confidence, the true amount of floorspace in commercial buildings in the U.S. in 2018 was 96,423 plus or minus 5,859 million square feet, or, the range was from 90,564 to 102,282 million square feet.
Statistical Significance Between Two Statistics
The difference between any two estimates given in the Detailed Tables may or may not be statistically significant. Statistical significance is computed as:
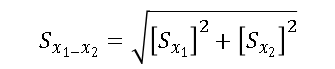
where S is the standard error, x1 is the first estimate, and x2 is the second estimate. The result of this computation is to be multiplied by 1.96 and, if this result is less than the difference between the two estimates, the difference is statistically significant at the 5% significance level. To test at the 10% significance level, the result is multiplied by 1.645.
For example, from Table B1, health care buildings were an average 29,300 square feet in 2018 with an RSE of 8.5 (found on the RSE tab of the Excel version of Table B1), while office buildings averaged 17,200 square feet with an RSE of 6.9, for an estimated difference of 12,100 square feet between the two building types. The standard error for health care buildings (x1) is (8.5/100)*29,300, or 2,491, and the standard error for office buildings (x2) is (6.9/100)*17,200, or 1,187. So, the equation above equals 2,759.
Multiplying 2,759 by 1.96 yields 5,408. Since 5,408 is less than 12,100, the difference between the two estimates is statistically significant at the 5% significance level.


