U.S. Energy Information Administration logo
Skip to sub-navigation
August 10, 2012

Wholesale electricity prices are lower during the first half of 2012
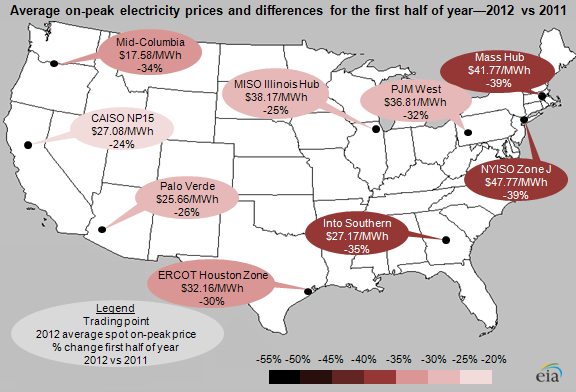
image of average wholesale electricity prices and percentage differences in price from 2011 for the first half of the year by trading point, as described in the article text
Source: U.S. Energy Information Administration, based on SNL Energy.

A combination of natural gas prices at 10-year lows and the warmest winter on record led to lower on-peak wholesale electricity prices so far in 2012. On-peak prices fell between 24% and 39% across major wholesale price hubs from January to June of 2012 compared to the same period of 2011 (see map above).

Off-peak (nights and weekends) electricity prices were also down for first-half 2012 compared to first-half 2011, although generally less than the declines in on-peak prices over that period (see map below). In contrast to other major power trading locations, off-peak prices in Northern California at CAISO NP15 increased 10% when compared to first-half 2011, mainly because of more nuclear outages this spring and record-breaking hydroelectric output during the spring of 2011. Off-peak prices generally reflect the cost of maintaining output from baseload generators, while on-peak prices reflect the price of generating from intermediate and peak generators throughout a given day.
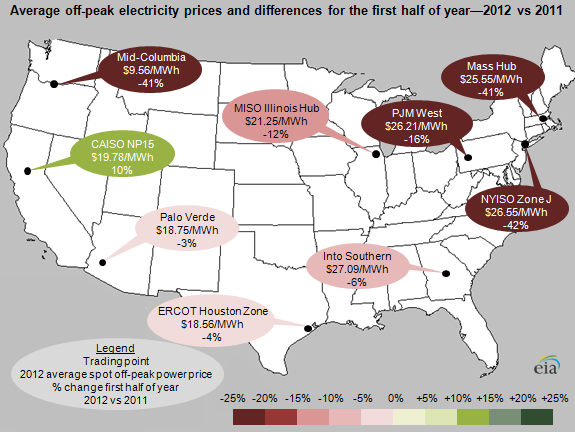
image of average wholesale electricity prices and percentage differences in price from 2011 for the first half of the year by trading point, as described in the article text
Source: U.S. Energy Information Administration, based on SNL Energy.

Spot natural gas prices during the first half of 2012 generally fell about 40-50% compared to the same period in 2011 and on some days neared their lowest levels in a decade. Lower natural gas prices led to increasing use of natural gas to generate electricity, contributing to lower wholesale electricity prices, especially for on-peak prices.

In 2012, twenty-eight states, mainly in the middle and eastern portions of the United States, reported their highest average daily temperatures for first half of any year during the past 118 years according to information reported by the National Oceanic and Atmospheric Administration (see map below). Warm weather at the start of 2012 contributed to reduced demand for both electricity and natural gas to heat homes, and contributed to lower wholesale natural gas and electricity prices.
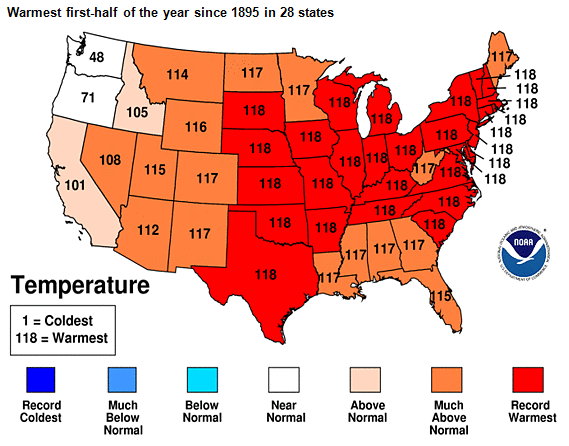
image of average wholesale electricity prices and percentage differences in price from 2011 for the first half of the year by trading point, as described in the article text
Source: National Oceanic and Atmospheric Administration National Climatic Data Center.
Note: A rank of 118 means temperatures in that state during January-June 2012 were the warmest in 118 years (or the highest on record). A rank of 117 indicates the second-warmest temperatures in that state, etc.

Statistics
Analysis
Tools
Education
News

Petroleum & Other Liquids

Crude oil, gasoline, heating oil, diesel, propane, and other liquids including biofuels and natural gas liquids.

Natural Gas

Exploration and reserves, storage, imports and exports, production, prices, sales.

Electricity

Sales, revenue and prices, power plants, fuel use, stocks, generation, trade, demand & emissions.

Coal

Reserves, production, prices, employment and productivity, distribution, stocks, imports and exports.

Nuclear & Uranium

Uranium fuel, nuclear reactors, generation, spent fuel.

Renewable & Alternative Fuels

Includes hydropower, solar, wind, geothermal, biomass and ethanol.

EIA Survey Forms

Forms EIA uses to collect energy data including descriptions, links to survey instructions, and additional information.

Total Energy

Comprehensive data summaries, comparisons, analysis, and projections integrated across all energy sources.

U.S. States

State energy information, including overviews, rankings, data, and analyses.

International

International energy information, including overviews, rankings, data, and analyses.

Environment

Greenhouse gas data, voluntary reporting, electric power plant emissions.

Data Tools, Apps, & Maps

Tools to customize searches, view specific data sets, study detailed documentation, and access time-series data.

Open Data

EIA's free and open data available as API, Excel add-in, bulk files, and widgets

EIA Beta

Come test out some of the products still in development and let us know what you think!

Open Source Code

EIA's open source code, available on GitHub.

RSS Feeds

Subscribe to feeds for updates on EIA products including Today in Energy and What's New.