
Reduced refinery activity puts upward pressure on gasoline and diesel prices
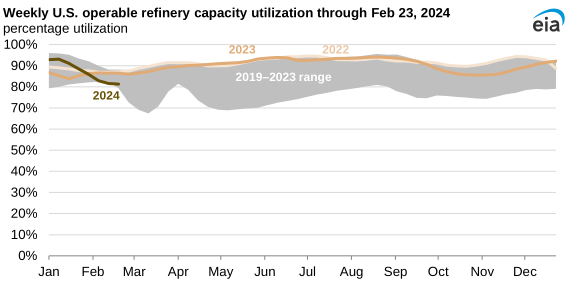
Since early January 2024, U.S. refinery utilization has decreased 11%, falling as low as 81% during the two weeks ending February 9 and February 16, and briefly dropped below the five-year (2019–23) low. Although U.S. retail average prices for gasoline and diesel are below 2023 prices for this time of year, decreasing regional inventories for the major U.S. refining regions increased retail prices for both fuels last month, according to our Gasoline and Diesel Fuel Update.
The sharp decline in refinery utilization is the result of reduced plant operations in both the Midwest and Gulf Coast regions and more intense seasonal patterns. The decline is also affecting inventories.
The U.S. Gulf Coast (PADD 3), the area with the largest drop in refinery utilization, has been the primary source of overall reduced U.S. refinery runs. Since the first week of January, U.S. Gulf Coast four-week average refinery utilization has decreased 14%, falling below 80% for the past two weeks. The reduced refinery runs are likely the result of weather-related issues stemming from cold temperatures, as well as planned maintenance. Weatherization against extreme cold is less common on the Gulf Coast compared with other regions, such as the Midwest, and a lack of winterization can contribute to power outages or damage to instruments, resulting in temporary shutdowns.
The current Gulf Coast refinery maintenance started earlier than normal and has had a larger impact on refinery operations. Trade press indicates maintenance shutdowns are underway at the Motiva Port Arthur and Marathon Galveston Bay refineries, which together account for about 7% of total U.S. capacity, or more than one million barrels per day of processing capacity. Planned refinery maintenance is typically seasonal and generally peaks during late February and March.
In the Midwest (PADD 2), bp’s refinery in Whiting, Indiana, (the largest refinery in the Midwest) was taken offline because of an unplanned outage. This outage is also a major source of reduced utilization nationwide and the driving force behind a 10% drop in Midwest regional refinery utilization since the first week in January.
Lower refinery production has led to decreased inventories of both motor gasoline and diesel (defined as distillate fuel oil with sulfur content under 15 parts per million) in the United States. In the Midwest, high refinery runs at the end of 2023 and logistical limitations on moving gasoline and diesel out of the region increased regional inventories of both fuels at the end of last year. Inventories started the year near or above five-year highs through early February. On the U.S. Gulf Coast, inventories also started the year at above-average levels but have since decreased significantly as refinery utilization has dropped. Inventories of both gasoline and diesel dropped below their 2023 levels.
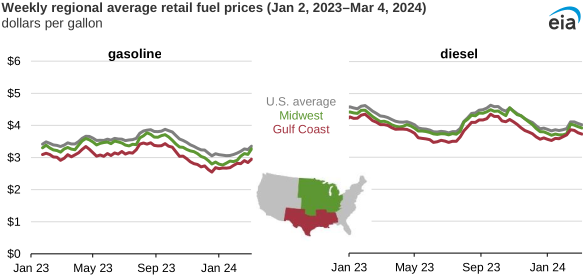
Note: Gasoline prices are for regular gasoline, all formulations, and prices are not adjusted for inflation.
As of Monday, March 4, regional retail gasoline prices increased in all regions compared with the previous Monday. Although similar increases occurred in mid-February, on-highway diesel prices have come down slightly in all regions in the last two weeks. Low U.S. Gulf Coast gasoline inventories will contribute to higher gasoline prices until more production is brought back online and stock levels increase. Although Midwest inventories are still closer to the high end of the five-year range, inventory draws will continue as long as the Whiting refinery remains offline.
Principal contributor: Kevin Hack
Tags: prices, refineries, gasoline, liquid fuels, diesel