Natural gas spot prices near 10-year lows amid warm weather and robust supplies
Natural gas prices have continued their downward trend this winter as a result of warmer-than-normal temperatures, ample natural gas in storage, and growing production. Population-weighted heating degree days since November 1, 2011 are down 12% nationally from the 30-year average. Total working natural gas in underground storage in the lower 48 states was 3,098 Bcf for the week ending January 20, 21% above the storage levels from one year ago. Daily dry gas production averaged about 64.2 billion cubic feet per day (Bcfd) in January, up almost 10% from last January.
Click on the tab headers below to see charts highlighting factors affecting natural gas prices.
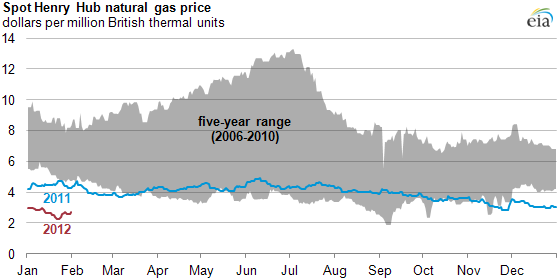
Natural gas spot prices near 10-year lows amid warm weather and robust supplies
Average spot natural gas prices for January were $2.68/MMBtu. Spot natural gas prices in January 2012 reached their lowest level in 10 years except for a 4-day period over the Labor Day weekend in 2009.
Winter 2011-2012 has been warmer than normal
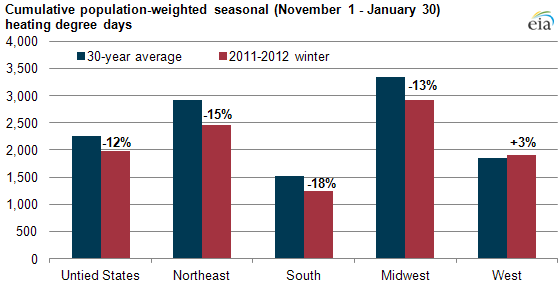
So far this winter, cumulative population-weighted heating degree days (HDDs) are down 12% nationally from the long-term average. In the northeast, a major winter natural gas consuming region, HDDs are down 15%. HDDs are also down 18% in the South and down 13% in the Midwest. This relative absence of cold weather has reduced natural gas demand and the need to pull natural gas from underground storage.
Natural gas storage levels exceed 5-year average range by over 500 billion cubic feet
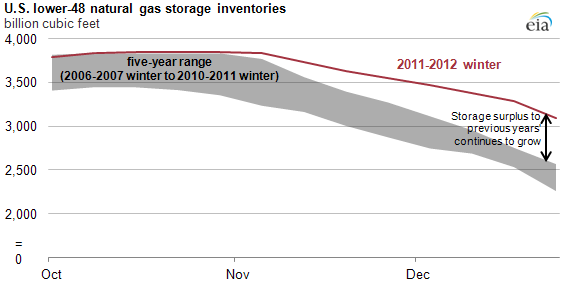
The combination of increased natural gas production and lower heating degree days has diminished the need to pull gas from storage. Weekly gas withdrawals have been lower than in previous years, and the current storage level (data for the week ending January 20, 2012) is 547 Bcf above the 5-year average. So far this winter, there have been only three reporting weeks with withdrawals of 100 Bcf or greater.
U.S. natural gas production continues to grow
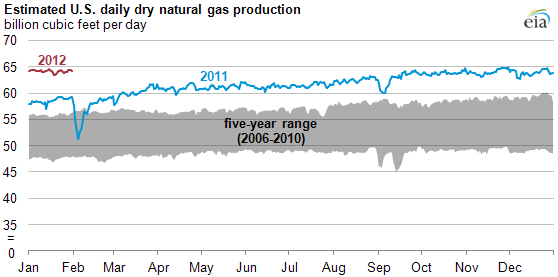
U.S. daily dry natural gas production averaged 64.2 billion cubic feet per day (Bcfd) in January 2012, up about 10% from the January 2011 level, according to Bentek Energy, LLC. Natural gas production in liquids-rich areas and shale plays, such as in portions of the Marcellus and the Eagle Ford, continues to boost natural gas production.
Weather outlook remains mild
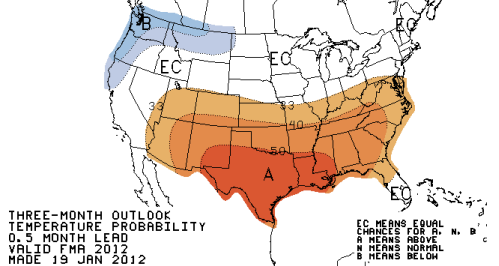
The current NOAA three-month outlook issued on January 19, 2012 (see map) spotlights above-average temperatures for much of the southern and eastern parts of the country. Mild weather could dampen natural gas demand for space heating and affect storage withdrawals. This weather outlook has contributed to lower natural gas price expectations, as shown in the next slide.
Expectations for natural gas prices have been falling
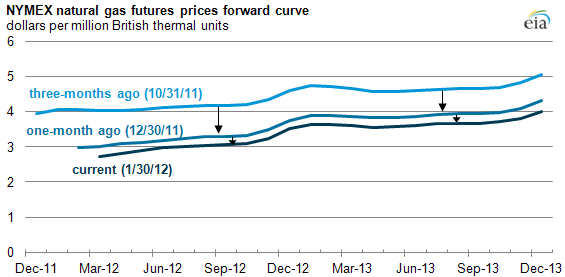
Continued strong natural gas production along with robust natural gas storage inventories and a mild weather outlook through the end of March has lowered expectations for forward natural gas prices. As shown in the chart, the NYMEX natural gas futures price outlook for the next two years is down about $1.08 per MMBtu per month on average, or 23% from three months ago.
Tags: futures, map, Marcellus, natural gas, prices, production/supply, shale, spot prices, storage, weather