
SoCalGas begins December with more flexibility in its natural gas supply than last winter
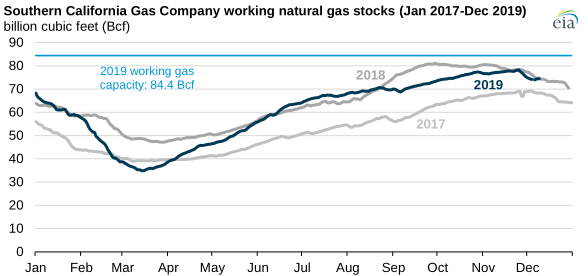
On December 10, 2019, Southern California Gas Company’s (SoCalGas) working natural gas inventory totaled 74.4 billion cubic feet (Bcf), nearly equal to the year-ago stock level and 9% higher than it was in 2017. Demand for natural gas in Southern California often peaks in December, when average temperatures in the region are typically at their lowest. Although the current stock level is similar to last winter’s, SoCalGas has more flexibility to withdraw natural gas from storage to meet winter demand than last year.
In July 2019, the California Public Utilities Commission (CPUC) approved new rules that make it easier for SoCalGas to withdrawal natural gas from its Aliso Canyon storage facility this winter. Following the October 2015–February 2016 leak, SoCalGas was only permitted to withdraw from Aliso Canyon as a last resort based on limitations established by the CPUC. Aliso Canyon, with current authorized working gas storage totaling 34 Bcf, is the largest storage facility available to SoCalGas.
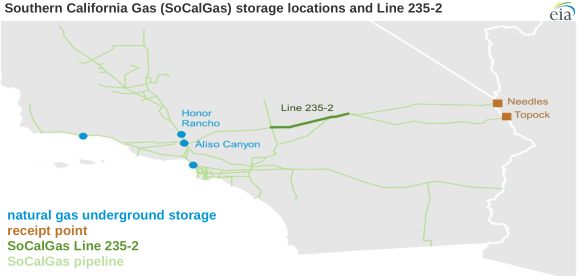
In addition, repairs to Line 235-2, located in southeastern California, were completed in October 2019, which increased pipeline capacity by 270 million cubic feet per day and increased access to lower-cost natural gas from the San Juan Basin and Permian Basin through the Needles and Topock receipt points. Line 235-2 had faced reduced capacity after an October 2017 rupture on the pipeline.
The National Oceanic and Atmospheric Administration’s winter outlook forecasts the 2019–2020 winter to be warmer and drier in Southern California than normal, which may minimize natural gas demand in the region. Last year, the average natural gas spot price at the SoCalGas Citygate during the winter (November 2018–March 2019) reached a record $6.93 per million British thermal units (MMBtu). Daily price spikes as high as $22.29/MMBtu occurred in February 2019 because of colder-than-normal weather and supply constraints.
However, this winter, market expectations—developed by S&P Global Market Intelligence based on information from natural gas futures and forwards markets—at the SoCalGas Citygate indicate lower natural gas prices than last winter’s record prices. These market expectations indicate that at the SoCalGas Citygate, energy traders value natural gas at $6.66/MMBtu in December 2019. They also indicate that the January-March 2020 average price is expected to be $4.08/MMBtu as of December 10.
The spot price at SoCalGas Citygate closed at $5.80/MMBtu on November 27, the last trading day in November; the region experienced colder-than-normal temperatures late in the month that put upward pressure on prices. Prices were also high as a result of maintenance at SoCalGas storage facilities. Withdrawal restrictions from November 15 through November 27 on the Honor Rancho storage facility, which comprises about 32% of SoCalGas’s current storage capacity, contributed to the high late-November prices. During the maintenance period, SoCalGas withdrew natural gas from the Aliso Canyon facility under the new withdrawal protocol.
Principal contributor: Stephen York
Tags: production/supply, natural gas, weather, California, states