
Recent decrease in U.S. crude oil production was geographically isolated, likely temporary
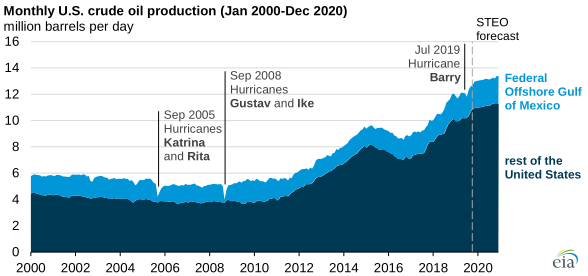
Monthly U.S. crude oil production fell by 276,000 barrels per day (b/d) in July 2019, based on the latest data in the U.S. Energy Information Administration’s (EIA) Petroleum Supply Monthly. This hurricane-related decrease was the largest decline in monthly crude oil production in more than a decade. The decline was temporary and geographically isolated to the Federal Offshore Gulf of Mexico. EIA expects that U.S. crude oil production will continue to increase through the remainder of 2019.
Crude oil production in the Federal Offshore Gulf of Mexico fell by 332,000 b/d in July when some production platforms were evacuated in anticipation of Hurricane Barry. According to information from the U.S. Department of the Interior’s Bureau of Safety and Environmental Enforcement (BSEE), 283 offshore oil and gas platforms in the Gulf of Mexico (about 42% of the regional total) were evacuated in mid-July as Barry approached.
BSEE estimated that about 70% of Gulf of Mexico crude oil production was shut in (i.e., not operating) at the peak of the disruption as a result of the evacuation. Excluding the Federal Offshore Gulf of Mexico, U.S. crude oil production in the rest of the United States rose by a combined 56,000 b/d in July, partially mitigating the disruption.
Historically, many of the largest monthly declines in U.S. crude oil production were the result of hurricanes. Hurricanes Gustav and Ike led to crude oil production falling by more than 1 million barrels per day in September 2008. Hurricanes Katrina and Rita led to a similar month-on-month decline in September 2005.
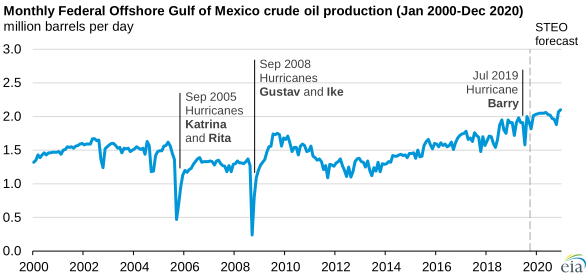
By comparison, Hurricane Barry’s disruption occurred relatively early in the hurricane season and had less of an effect on total U.S. crude oil production. As onshore U.S. crude oil production has grown, the Gulf of Mexico’s share of the national total has fallen from a high of 29% in 2009 to 16% in 2018.
In developing crude oil production forecasts for each month’s Short-Term Energy Outlook, EIA uses the latest data from the Petroleum Supply Monthly and Weekly Petroleum Status Report, among other sources. As a result, EIA had already accounted for estimates of Hurricane Barry’s effect on crude oil production in the Gulf of Mexico in the August edition of the STEO.
In the October STEO, released earlier this week, EIA expects that U.S. crude oil production will increase in each remaining month of 2019, and ultimately reach 13.0 million b/d in December 2019. EIA expects U.S. crude oil production to average 12.3 million b/d in 2019 and 13.2 million b/d in 2020.
Principal contributor: Owen Comstock