New U.S. power plants expected to be mostly natural gas combined-cycle and solar PV
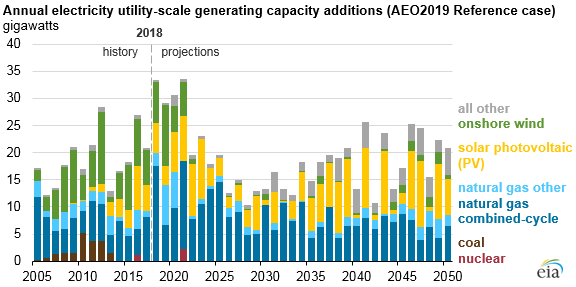
EIA’s long-term projections show that most of the electricity generating capacity additions installed in the United States through 2050 will be natural gas combined-cycle and solar photovoltaic (PV). Onshore wind looks to be competitive in only a few regions before the legislated phase-out of the production tax credit (PTC), but it becomes competitive later in the projection period as demand increases and the cost for installing wind turbines continues to decline.
For EIA’s Annual Energy Outlook 2019 (AEO2019), EIA calculates two measures that, when used together, provide an intuitive framework for understanding the capacity expansion decisions modeled for utility-scale power plants—those with a capacity rating of 1 megawatt (MW) or greater.
The levelized cost of electricity (LCOE) represents the cost to build and operate a power plant, converted to a level stream of payments over the plant’s assumed financial lifetime. Installed capital costs include construction costs and financing costs. Operating costs include fuel costs (for power plants that consume fuel) and expected maintenance costs. LCOEs may also include other applicable tax credits or subsidies.
The levelized avoided cost of electricity (LACE) accounts for the differences in the grid services each generating technology is providing (a power plant’s value) to the grid. For example, natural gas combined-cycle plants and coal plants provide dispatchable baseload services to the grid and thus have similar LACE values, even if their LCOE values differ. A generator’s avoided cost provides a proxy for the potential revenues from sales of electricity generated. As with LCOE, these revenues are converted to a level stream of payments over the plant’s assumed financial lifetime.
The ratio of these two measures serves as a value-to-cost ratio. Power plants are considered economically attractive when their projected LACE exceeds their projected LCOE, meaning their value-cost ratio exceeds one.
The relative costs and values of several technology options are calculated for each of the 22 electricity regions in the modeling system used to inform EIA’s Annual Energy Outlook. Calculations start in 2021 because that is the first feasible year that all three technologies are available to come online in the model, given the assumed construction lead-time and licensing requirements.
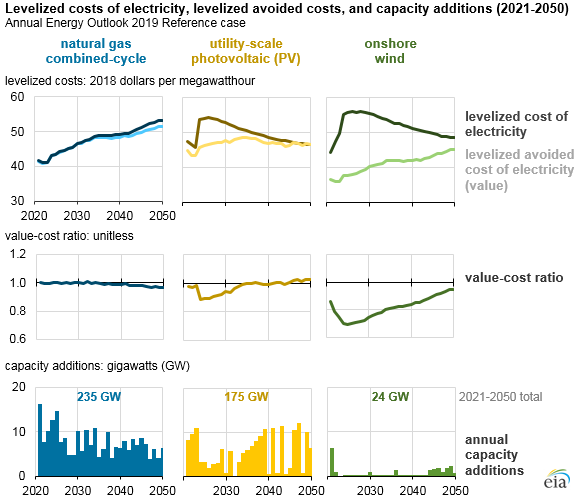
Because both LCOE and LACE are levelized over the lifetime of the plant, these values change over time. Natural gas combined-cycle units’ LCOEs increases gradually as natural gas prices rise. Utility-scale solar photovoltaic (PV) and onshore wind’s LCOEs initially increase as a result of the loss of the tax credits but then decrease because of the continued decline in installed costs. Wind’s LCOE may also increase as the best wind resource sites are built out and new projects must be installed in areas that have either lower wind resources or less ease of access.
Natural gas combined-cycle units are considered, on average, the marginal source of electricity generation through 2050, meaning the cost of electricity generation from this technology is most often the basis of comparison for new power plants. As natural gas prices increase, the marginal source becomes more expensive to operate, and the value to the grid of avoiding this cost by building new capacity increases, as seen in the general upward trend in LACE for natural gas combined-cycle and onshore wind.
Conversely, solar PV’s LACE is generally flat to declining during the projection period. As solar penetration in the grid increases, solar capacity saturates during the midday hours, causing the value of electricity delivered in those hours to decrease.
In the AEO2019 Reference case, natural gas combined-cycle’s value-cost ratio is closest to 1.0 throughout the projection, indicating that its value just covers its costs. Natural gas combined-cycle units account for the largest share of new power plants (43% of the utility-scale total from 2021 through 2050). Solar PV’s value-cost ratio is slightly less than 1.0, indicating that, on average, its value does not cover its costs, but capacity is still added. In some cases, these solar PV additions may be uneconomic, but they still occur to satisfy the renewable portfolio standard (RPS) requirements in 29 states and the District of Columbia.
Onshore wind’s value-cost ratio remains lower than 1.0 throughout the projection period and lower than solar PV. Consequently, little onshore wind is installed in the Reference case, except in the near term when wind capacity is built to take advantage of the available PTC.
More information about LCOE, LACE, and economic competitiveness of electricity generating technologies is available in EIA’s Levelized Cost and Levelized Avoided Cost of New Generation Resources in the Annual Energy Outlook 2019 report.
Principal contributor: Manussawee Sukunta
Tags: generation, electricity, natural gas, power plants, solar