
U.S. monthly crude oil production exceeds 11 million barrels per day in August
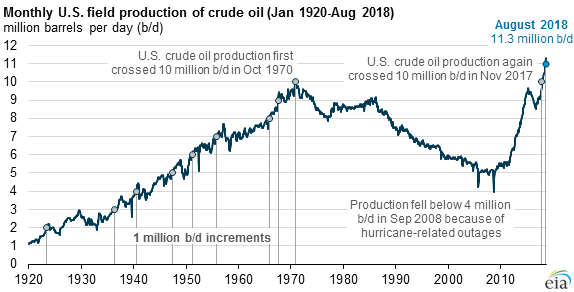
U.S. crude oil production reached 11.3 million barrels per day (b/d) in August 2018, according to EIA’s latest Petroleum Supply Monthly, up from 10.9 million b/d in July. This is the first time that monthly U.S. production levels surpassed 11 million b/d. U.S. crude oil production exceeded the Russian Ministry of Energy’s estimated August production of 11.2 million b/d, making the United States the leading crude oil producer in the world.
Monthly crude oil production reached a record high in several states. Texas had the highest record level at 4.6 million b/d, followed by North Dakota at 1.3 million b/d. Other states that had record-high production levels were New Mexico, Oklahoma, Colorado, and West Virginia. Production in the Federal Offshore Gulf of Mexico also hit a record high of 1.9 million b/d.
The Permian region, which is located in western Texas and eastern New Mexico, accounts for about 63% of total Texas crude oil production and 95% of total New Mexico crude oil production. From January 2018 to August 2018, Texas crude oil production increased by 683,000 b/d (15%) and New Mexico production increased by 182,000 b/d (25%).
The growth in Texas and New Mexico since the start of 2018 surpassed EIA’s previous expectations, which assumed that pipeline capacity constraints in the Permian region would dampen production growth in response to the increased differential between the West Texas Intermediate (WTI) crude oil price at Cushing, Oklahoma, and the WTI price at Midland, Texas. In August 2018, this differential had grown to more than $16 per barrel (b), up from $0.43/b in January. However, industry efficiencies in pipeline utilization and increased trucking and rail transport in the region have allowed crude oil production to continue to grow at a higher rate than EIA expected.
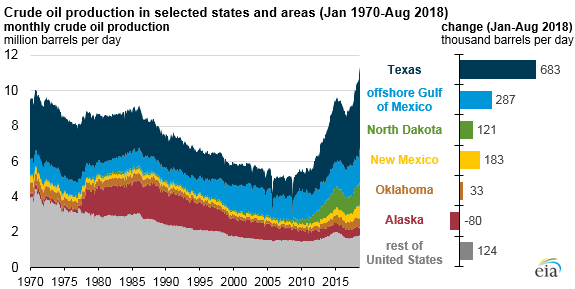
From May through August, production in the Gulf of Mexico grew by an average of 130,000 b/d every month, a significant increase from the growth rate in the first four months of the year. This increase was primarily the result of a number of fields returning to full production after several months of maintenance and other infrastructure issues that arose from Hurricanes Harvey and Nate in 2017.
U.S. crude oil production has increased significantly during the past ten years, driven mainly by production from tight oil formations using horizontal drilling and hydraulic fracturing. EIA estimates of crude oil production from tight formations in August 2018 reached 6.2 million b/d, or 55% of the national total.
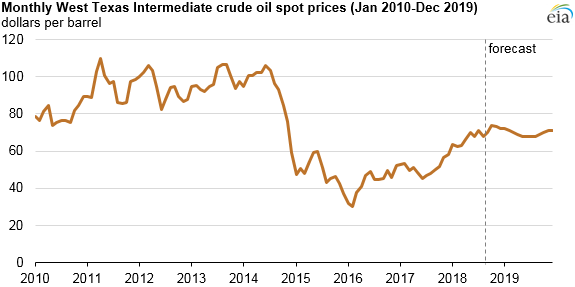
WTI-Cushing spot prices averaged about $68/b in August, down from the July average of $71/b. EIA’s Short-Term Energy Outlook forecasts the average spot price for WTI to remain near that level in the fourth quarter of 2018. The higher crude oil prices at the end of 2018 and throughout 2019 will likely support increased U.S. crude oil production. EIA forecasts U.S. crude oil production to increase by 1.0 million b/d in 2019.
Principal contributors: Emily Geary, Danya Murali