
Natural gas storage design capacity increased slightly in 2017
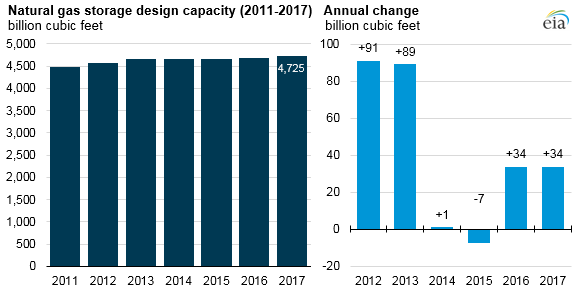
Over the past four years, relatively little new underground natural gas storage capacity was built in the Lower 48 states. EIA measures natural gas storage capacity in two ways: design capacity and demonstrated maximum working gas volume (or demonstrated peak). In 2017, design capacity grew by about 1%, and demonstrated peak fell by 1%.
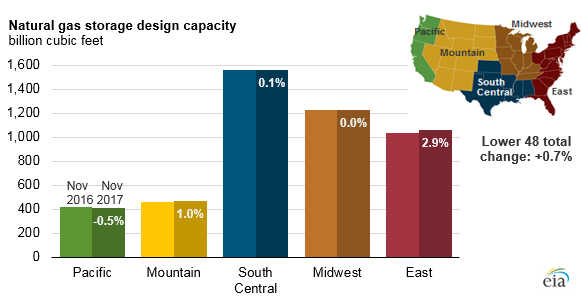
Design capacity is the sum of the working gas capacity for all active facilities in the Lower 48 states as of November 2017. Design capacity is based on the physical characteristics of the reservoir, installed equipment, and operating procedures particular to the site. Nationally, design capacity rose by 34 billion cubic feet (Bcf), or 0.7%, between November 2016 and November 2017. This increase was driven by expansion in the East storage region, where design capacity grew by 30 Bcf (2.9%) in 2017.
Most of the incremental capacity in 2017 came from expansions to existing facilities, and expansions were heavily concentrated in the East region, where natural gas production has grown almost continually since 2009. Several facilities in Ohio and West Virginia likely expanded in 2017 to accommodate increasing levels of natural gas production in the Appalachian Basin.
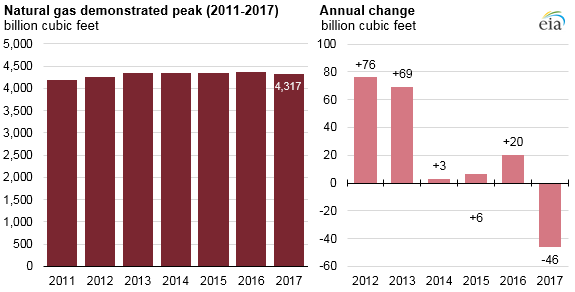
Demonstrated peak is the sum of the highest storage levels reached by each storage facility over the most recent five-year period, with the most recent period covering December 2012 to November 2017 (the beginning of each yearly heating season). Demonstrated peak indicates how storage facilities were actually used, not just how they were designed.
The demonstrated peak fell by 46 billion cubic feet (Bcf), or 1.0%, in 2017. EIA began tracking peak capacity metrics in 2011, and 2017 marks the first year that the demonstrated peak declined. The decline was partly because the new five-year range does not include 2012, a year that saw very high inventory levels because of record warm weather.
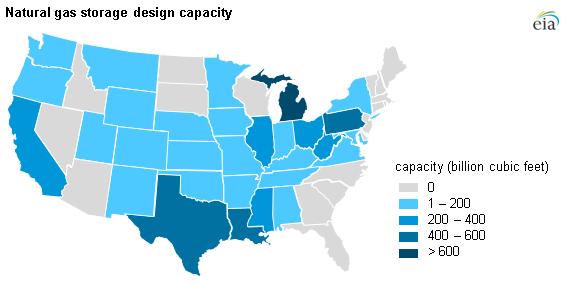
Storage capacity in a given state may be a function of several things, including production, consumption, existing infrastructure, geography, and geology. States with high levels of natural gas production, such as Texas and Louisiana, also tend to have substantial volumes of underground storage capacity. These states have well-developed natural gas infrastructure, many large industrial and electric sector consumers, and geology that is amenable to storage.
Michigan has the highest amount of natural gas storage design capacity in the country, but it has modest levels of natural gas production compared with Texas and Louisiana. However, Michigan relies heavily on natural gas for winter heating needs and has several factors that have led to investments in storage: several major pipelines that connect to Canada and other Midwestern states, nearby population centers such as Chicago, and depleted production fields that it was able to convert into storage fields.
Principal contributor: Mike Kopalek
Tags: inventories/stocks, map, natural gas, states, storage