U.S. crude oil exports increased and reached more destinations in 2017
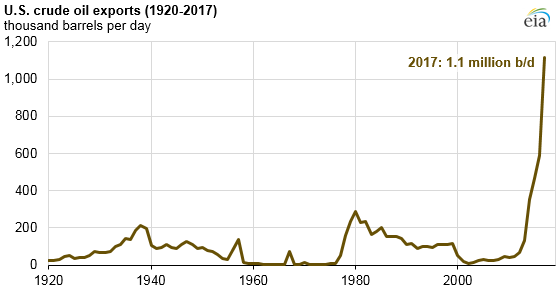
U.S. crude oil exports grew to an average of 1.1 million barrels per day (b/d) in 2017, the second full year since restrictions on crude oil exports were removed. Crude oil exports in 2017 were nearly double the level of exports in 2016. Increased U.S. crude oil exports were supported by increasing U.S. crude oil production and expanded infrastructure.
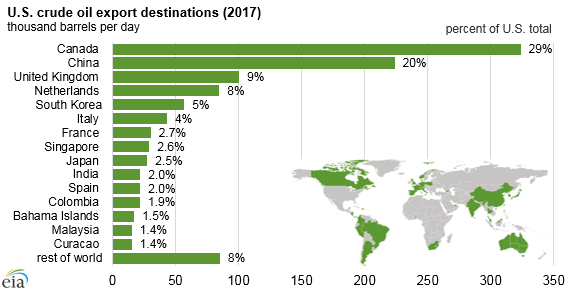
U.S. crude oil exports went to 37 destinations in 2017, compared with 27 destinations in 2016. Similar to previous years, Canada remained the largest destination for U.S. crude oil exports, but Canada’s share of total U.S. crude oil exports continued to decrease, down from 61% in 2016 to 29% in 2017. U.S. crude oil exports to China accounted for 202,000 b/d (20%) of the 527,000 b/d total increase. China surpassed the United Kingdom and the Netherlands to become the second-largest destination for U.S. crude oil exports in 2017.
Many European nations are among the largest destinations for U.S. crude oil exports, including the United Kingdom, Netherlands, Italy, France, and Spain. India, which did not receive U.S. crude oil exports in 2016, received 22,000 b/d in 2017, tying with Spain as the tenth-largest destination.
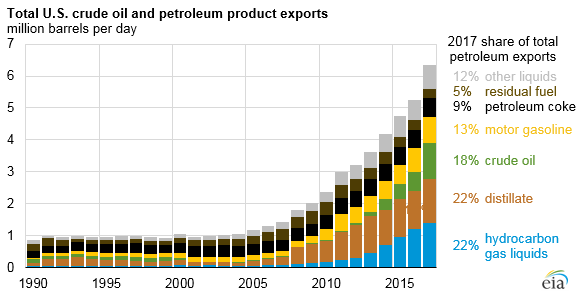
Crude oil now makes up 18% of total U.S. petroleum exports, making it the third-largest petroleum export after hydrocarbon gas liquids (HGL) and distillate fuel. Before the restrictions on domestic crude oil exports were lifted in December 2015, most of the growth in U.S. petroleum exports was petroleum products—mainly HGLs (such as propane), distillate fuel, and motor gasoline. Previously, crude oil’s largest share of total U.S. petroleum exports was 13% in 1999, when total volumes of U.S. petroleum exports were less than 1.0 million b/d, which was much lower than the 6.3 million b/d total in 2017.
Increasing U.S. crude oil production and expansions of U.S. pipeline capacity and export infrastructure facilitated increased crude oil exports. U.S. crude oil production reached 9.3 million b/d in 2017, a 0.5 million b/d increase from 2016. Several new or expanded pipelines came online in 2017 to move crude oil from producing regions, primarily the Permian basin of Texas and New Mexico, to the U.S. Gulf Coast. On the U.S. Gulf Coast, recently expanded crude oil export infrastructure in ports such as Corpus Christi and Houston, Texas, and in ports along the Mississippi River in Louisiana allowed larger volumes of crude oil exports.
A larger discount of domestic crude oil prices, represented by West Texas Intermediate (WTI) crude oil, to international crude oil prices, represented by Brent, reflects these dynamics. Spot Brent crude oil prices averaged $3.36 per barrel (b) more than WTI prices in 2017 compared with just $0.40/b more in 2016, providing a price incentive to export U.S. crude oil into the international market.
Similar production, infrastructure, and price conditions will be necessary for U.S. crude oil exports to continue increasing. EIA’s March Short-Term Energy Outlook forecasts U.S. crude oil production to increase by 1.4 million b/d in 2018 and the Brent-WTI spread to average $3.96/b.
Principal contributor: Mason Hamilton