
S&P 500 implied volatility briefly surpassed that of crude oil in February
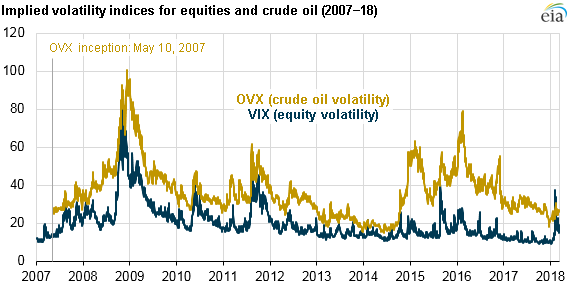
For four consecutive days in early February, stock market implied volatility surpassed crude oil price volatility for the first time since 2008. The VIX, a measure of implied volatility, or the market’s expected range of near-term price changes on Standard and Poor’s (S&P) 500 index options, closed higher than the OVX, a measure of implied volatility on crude oil options. The VIX has only closed higher than the OVX four other times since the inception of the OVX in 2007; all previous instances were in 2008.
Under typical trading conditions, a single commodity—in this case, the price of West Texas Intermediate (WTI) light, sweet crude oil, the underlying commodity for OVX—would be expected to have higher implied volatility compared with an index whose underlying value consists of a basket of 500 large capitalization stocks representing a variety of U.S. companies.
Both the VIX and OVX were highest during the financial downturn of late 2008: VIX reached a high of nearly 90 in late October of that year, and OVX surpassed 100 in mid-December. More recently, crude oil implied volatility reached a high of 80 in early 2016 during a time of significant increases in crude oil inventories and uncertainty surrounding Chinese economic growth.
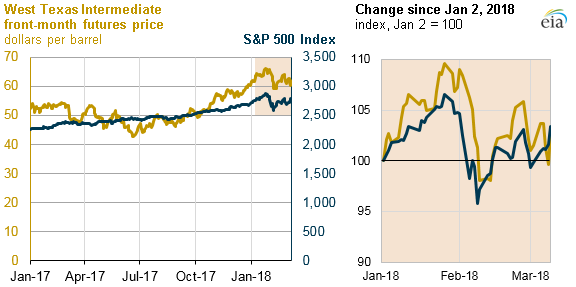
Even though both the VIX and the OVX have declined since early February, they remain at higher levels than at the beginning of 2018. When implied volatilities were high in early February, prices for both the S&P 500 and WTI crude oil were falling. As of March 9, both prices have since increased and are now closer to levels seen at the beginning of 2018.
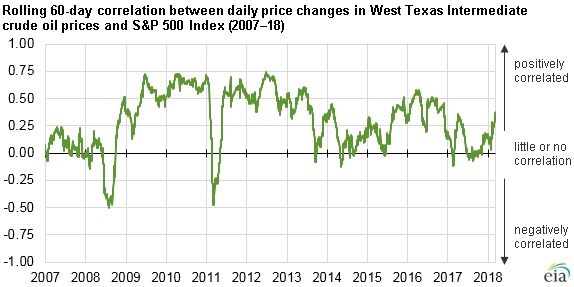
Although crude oil and stock markets often move independently because of factors specific to each market, several times in the past 10 years, prices in these markets have shown higher daily correlations, or the tendency to change in the same direction on a daily basis. The rolling 60-day correlation between daily price changes of WTI crude oil and the S&P 500 index recently increased from a period of almost no correlation, which lasted from mid-2017 through the end of January 2018, to a correlation of 0.38 as of March 9. A correlation of 1.0 would mean that the two prices moved together exactly proportionally on a daily basis.
The direct causes of increased correlations between oil prices and stock prices remain uncertain. Both oil prices and stock prices could be responding to inflation data that may trigger tighter monetary policy by the U.S. Federal Reserve. January's employment report initially showed average hourly earnings increased at the highest annual rate since 2009 before being revised down in February, for example, which could contribute to higher inflation.
In addition, increased trading volume of inverse VIX exchange-traded funds (ETF) and exchange-traded notes, as well as direct selling of VIX futures contracts, could have contributed to higher volatility. An inverse VIX ETF is designed to provide short exposure (the equivalent of selling a futures contract) to the VIX. When large numbers of holders sell inverse VIX ETFs, the underlying fund manager must purchase VIX futures, which could have contributed to an increase in the VIX. Significant increases in price volatility can also reflect high uncertainty about future economic growth.
Principal contributor: Jeff Barron
Tags: crude oil, financial markets, liquid fuels, prices